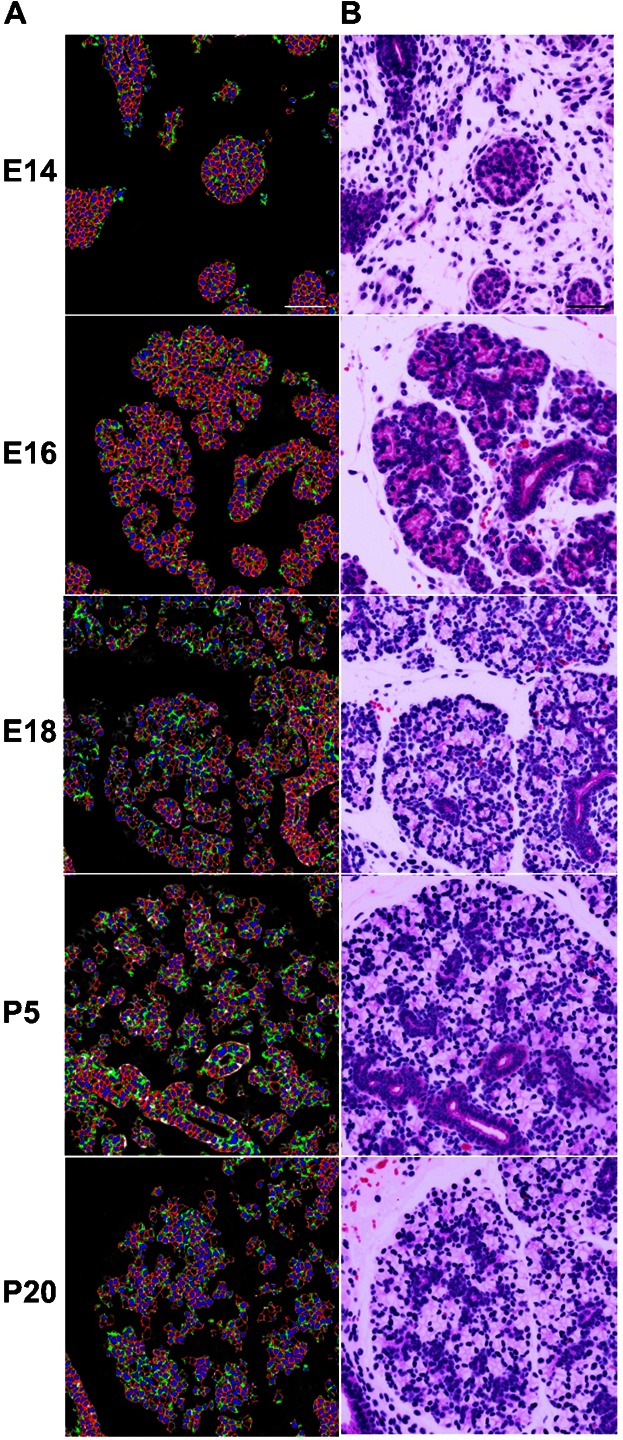
Fig. 2. Single cell segmentation of the epithelium and comparison with simulated hematoxylin and eosin (H&E) stained images.

(A) Using a developmental TMA, MxIF was used to identify markers of cell type and cell subcompartments: epithelium (E-cadherin and pan-keratins), plasma membrane (Na+/K+-ATPase and pan-cadherin), cytoplasm (S6), and nuclei (DAPI) (supplementary material Fig. S1). An epithelial mask was computed using the E-cadherin and pan-cytokeratin stains and used to identify cells with the algorithm that uses the cell membrane, cytoplasm, and nuclei stains to identify individual cells. Computationally segmented epithelial cell membranes are displayed in (red), cytoplasm (green), and nuclei (blue), and are displayed on top of an image of E-cadherin to identify the epithelial cells. Each cell was assigned a unique identifier (data not shown) for quantification. (B) The cell segmentation in A was used to computationally generate corresponding simulated histological H&E images, which are displayed for comparison to illustrate the tissue morphology. Scale bars: 50 µm.
