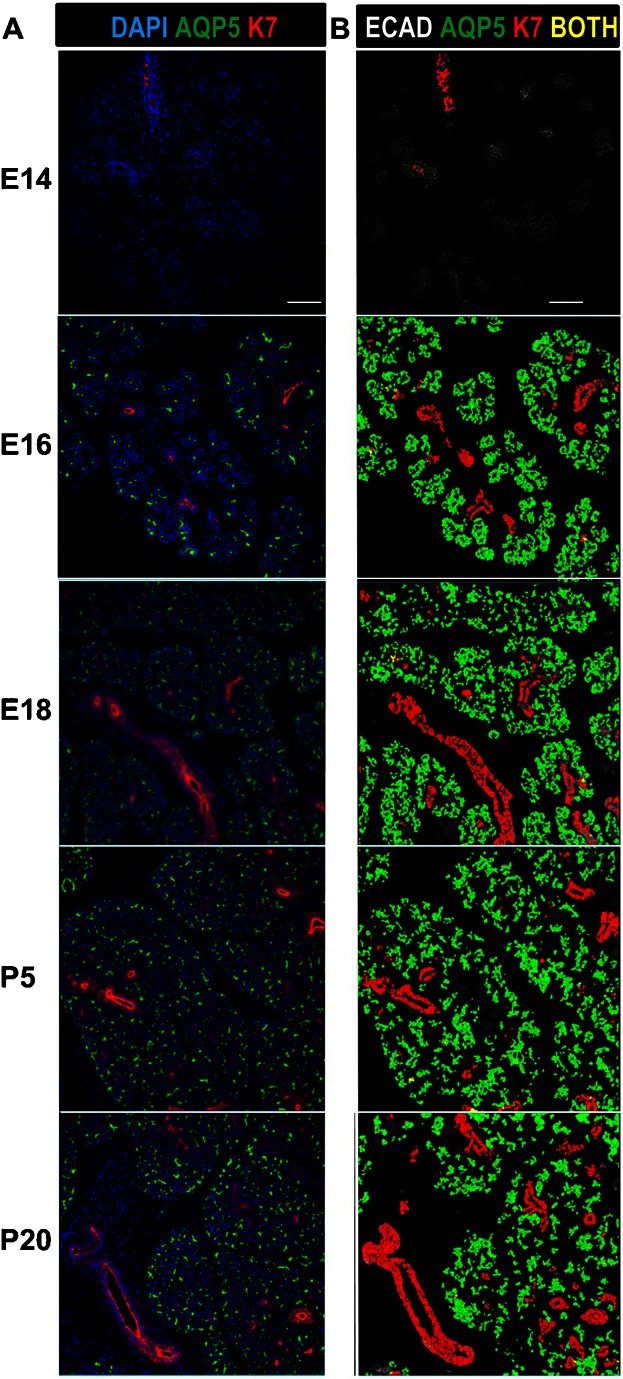
Fig. 3. Quantitative spatio-temporal analysis of proacinar and ductal cell populations during submandibular development.

(A) The proacinar and ductal SMG cell populations were identified using antibodies to detect AQP5 (green) or K7 (red), respectively, with DAPI staining of total nuclei (blue). (B) Statistical outputs from A were overlaid on E-cadherin-stained images (white) to produce overlays of the computationally identified proacinar (green) and ductal (red) epithelial cell populations. Cells that segregate both as acinar and ductal are labeled in yellow. Note that almost all cells are either proacinar or ductal, with very little overlap detected between these lineage markers. Developmental stages are as indicated. Numerical data for the quantitative cell analysis is shown in Table 2. Scale bars: 100 µm.
