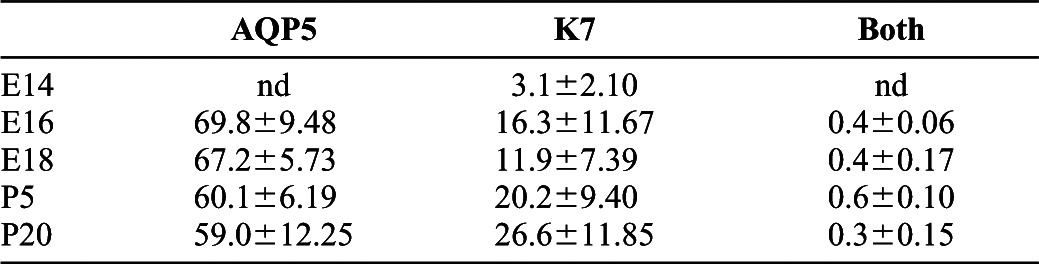
Table 2. Percentages of acinar and ductal marker-expressing cells throughout SMG development.
Single cell analysis data from the MxIF of the SMG developmental TMAs and overlays of statistical data onto the immunostains were used to calculate the percentages of total epithelial cells segmented expressing the proacinar/acinar and ductal cell markers AQP5 and K7, respectively, as represented in </emph>Fig. 3. Averages of three counts for three positions for each developmental stage are shown with standard deviations as total percent of cells positive for each marker alone and total percent positive for both makers. nd denotes conditions where immunoreactivity was not detected. Note the near complete lack of co-expression of these lineage markers throughout development.