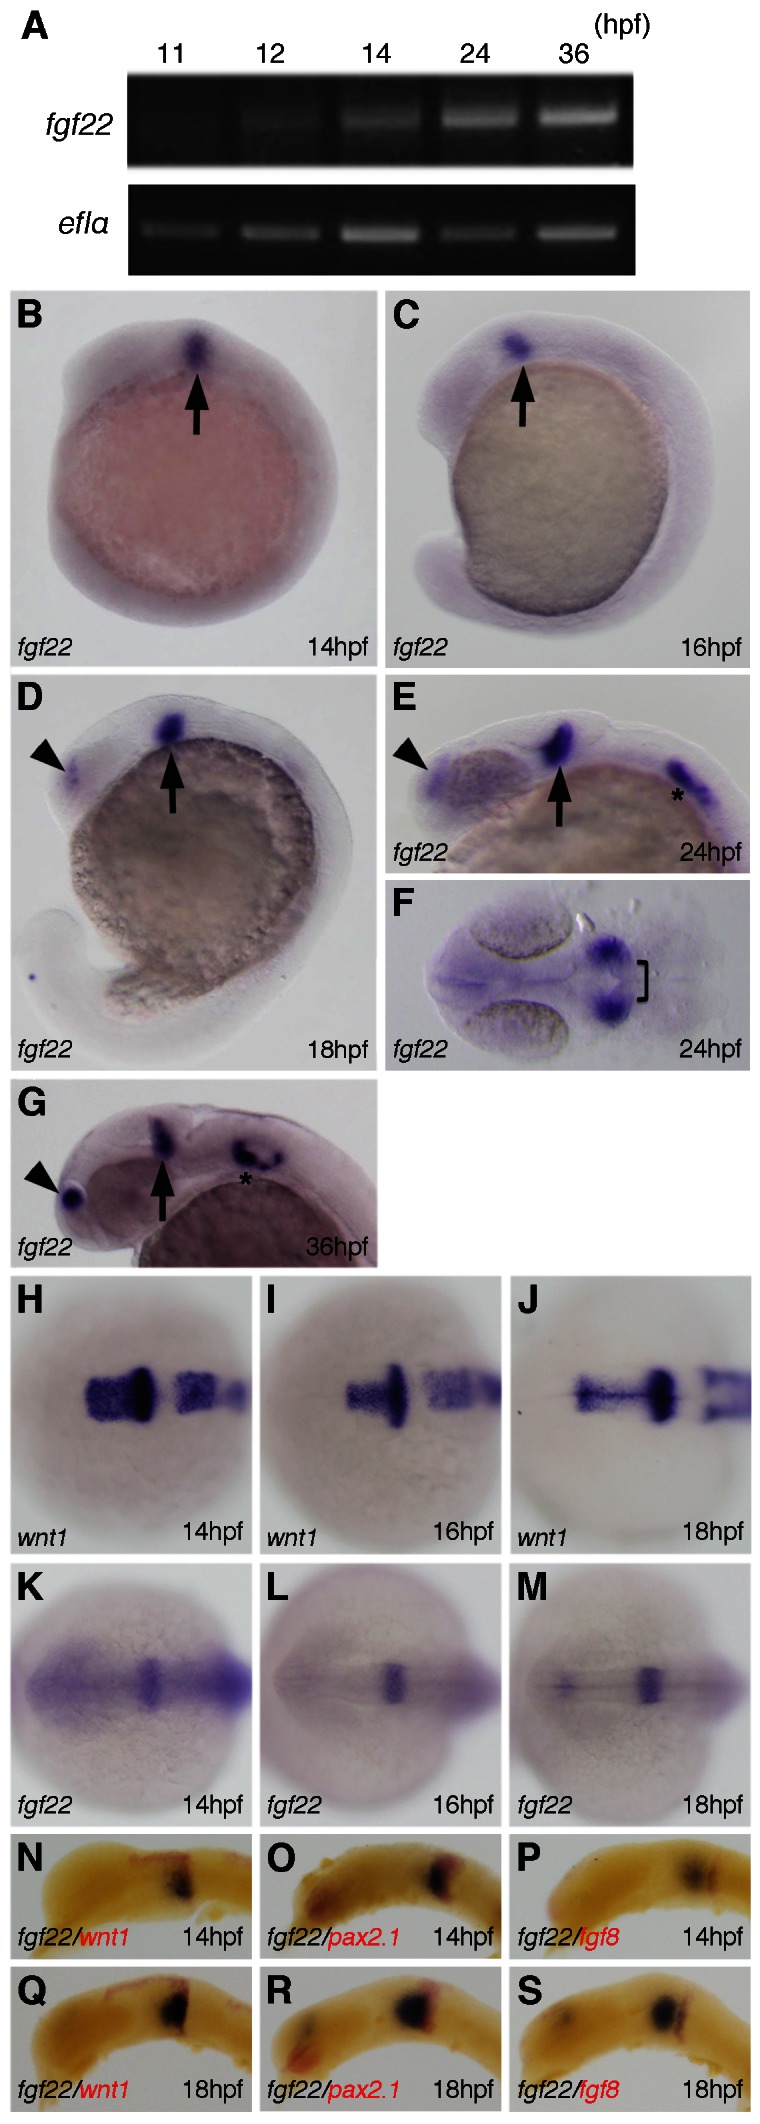
Fig. 1. Expression of fgf22 in zebrafish embryos.

(A) Amplification of fgf22 by RT-PCR at the indicated stages. The lower panel shows results for ef1α as a control. (B–S) Expression pattern of fgf22 (B–G,K–S) and wnt1 (H–J) in zebrafish embryos at the indicated stages detected by whole-mount in situ hybridization. Embryos were double-labeled for wnt1 (red) (N,Q), pax2.1 (red) (O,R), or fgf8 (red) (P,S). Lateral views with anterior to the left and dorsal to the top (B–D,G,N–S). Dorsal views with anterior to the top (F,H–M). Arrowheads and asterisks indicate the telencephalon and otic vesicles, respectively.
