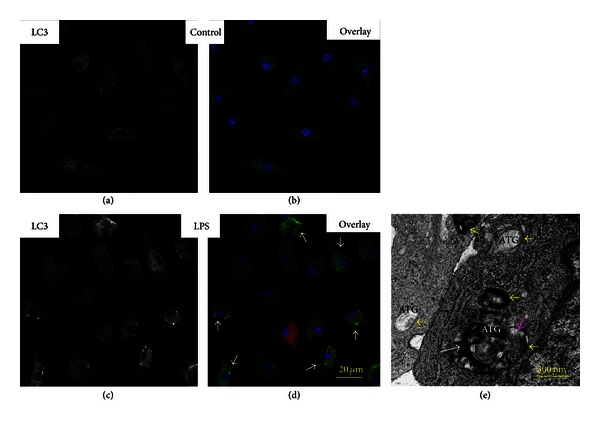
Figure 10.

Assessment of autophagosome formation in MSCs challenged with LPS. ((a)–(d)) Confocal immunofluorescence imaging. (a) Green channel. LC3 projection in control MSCs. (b) Overlay of projections of LC3 (green channel), iNOS (red channel), and nuclei (blue channel) in control MSCs. (c) Green channel. LC3 projection in MSCs challenged with LPS. (d) Overlay of projections of LC3 (green channel), iNOS (red channel), and nuclei (blue channel) in MSCs challenged with LPS. Spatial localization of LC3 is indicated with white arrows. Conditions: MSCs were incubated with 500 ng/mL LPS for 3 h. The cells were analyzed 24 h after challenge with LPS. Counterstaining of nuclei was with Hoechst 33342 (blue channel). The confocal images were taken with pinhole setup to obtain 0.5 μm Z-sections. (e) TEM image of MSCs challenged with LPS. Autophagosome (ATG) membranes are indicated with yellow arrows; fragments of mitochondrion in ATG are indicated with white arrow; fusion of lysosomes with ATG is indicated with pink arrow.
