
Figure 2.
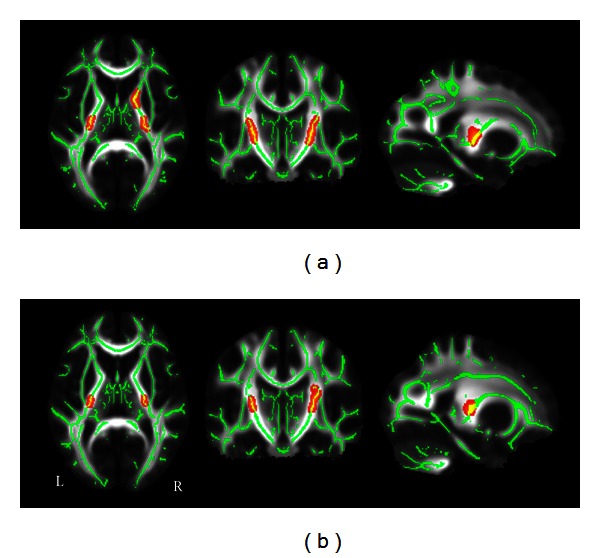
TBSS shows increased white matter FA in CB (a) and LB (b) compared to the SC using a loose thfreshold. Green represents mean FA skeleton of all participants; red color represents regions with significant increased FA in each of the two blind groups (P < 0.05, uncorrected). CB: congenitally blind; FA: fractional anisotropy; SC: sighted control; TBSS: tract-based spatial statistics; L: left; LB: late blind; and R: right.