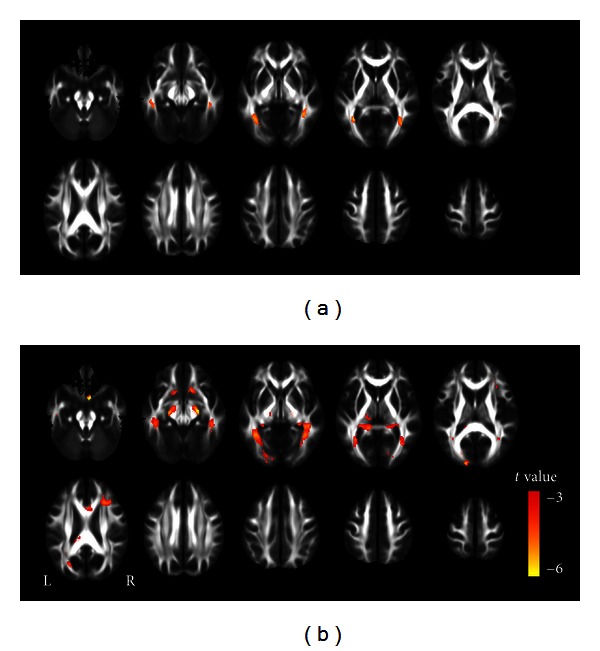
Figure 3.

FA differences between the CB or LB and SC groups using a VBA method. The CB subjects show decreased FA in the bilateral optic radiations compared to the SC subjects (a). The LB subjects show decreased FA in multiple regions than the SC subjects (b). Red represents regions with significant decreased FA in each of the two blind groups (P < 0.01, FDR corrected). CB: congenitally blind; FA: fractional anisotropy; SC: sighted control; L: left; LB: late blind; R: right; and VBA: voxel-based analysis.
