
Figure 1.
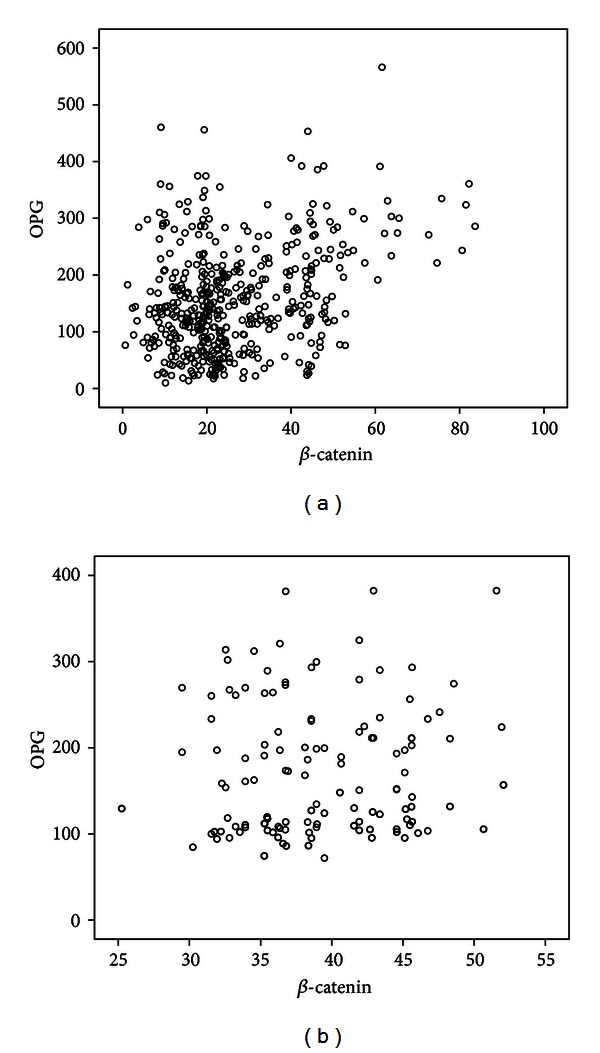
Univariate correlation (Spearman analysis) between β-catenin and OPG serum levels in PMOP patients ((a) r = 0.232, P < 0.001) and controls ((b) r = 0.112, P = 0.145).
Official websites use .gov
A
.gov website belongs to an official
government organization in the United States.
Secure .gov websites use HTTPS
A lock (
) or https:// means you've safely
connected to the .gov website. Share sensitive
information only on official, secure websites.
Univariate correlation (Spearman analysis) between β-catenin and OPG serum levels in PMOP patients ((a) r = 0.232, P < 0.001) and controls ((b) r = 0.112, P = 0.145).