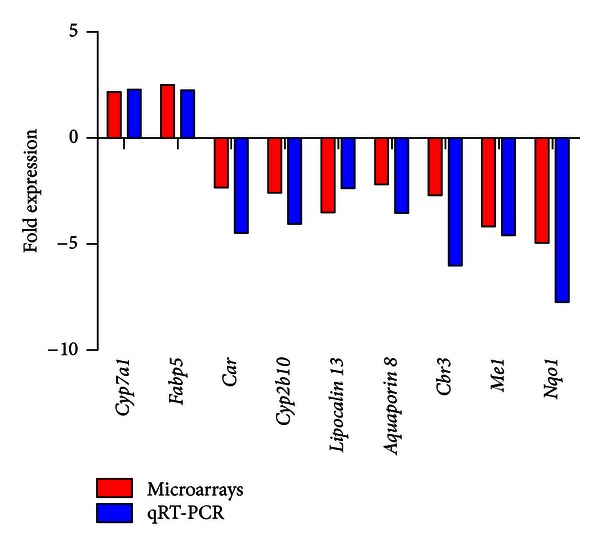
Figure 2.

Correlation between microarray and qRT-PCR data. Nine genes identified by microarray analysis differentially expressed in the liver between Nrf2-KO and WT mice after 180 days on HFD were selected for qRT-PCR quantification. The red bars show the fold difference in the mRNA expression of a gene as calculated by microarray analysis, and the blue bars show the relevant fold difference as calculated by qRT-PCR analysis. Very good agreement was observed between the microarrays and qRT-PCR (Pearson correlation coefficient = 0.919; P = 0.0004).
