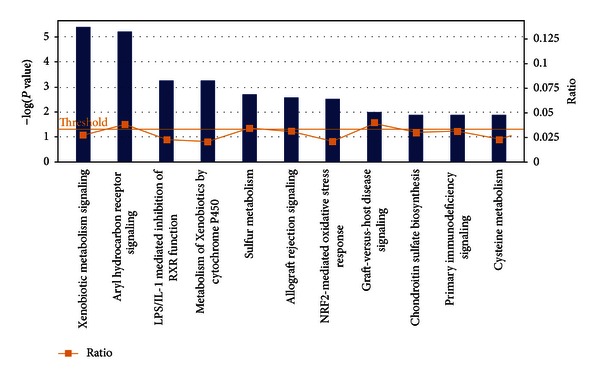
Figure 3.

Significantly enriched canonical pathways identified by IPA. The diagram shows significantly overrepresented canonical pathways. A multiple testing corrected P value was calculated using the Benjamini-Hochberg method to control the rate of false discoveries in statistical hypothesis testing. The ratio value represents the number of molecules in a given pathway that meet cutoff criteria, divided by the total number of molecules associated with the respective biological function.
