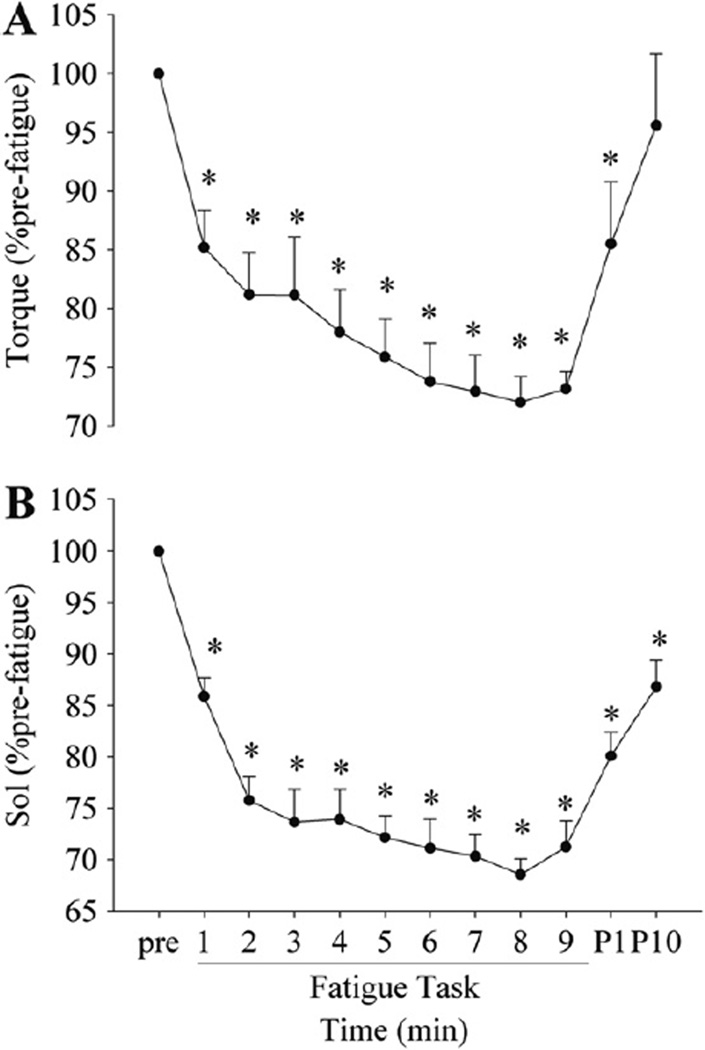
Fig. 2.
Changes in the voluntary torque (A) and voluntary Sol EMG activity (B) during and after the fatigue task. Pre, P1 and P10 indicate pre-fatigue, post 1- and 10-min fatigue task, respectively. The greatest decline in torque and EMG activity was found during the 1st cycle, followed by a more gradual, but significant decrease by the end of the task for both torque and EMG. *p < 0.05 from pre-fatigue values.

