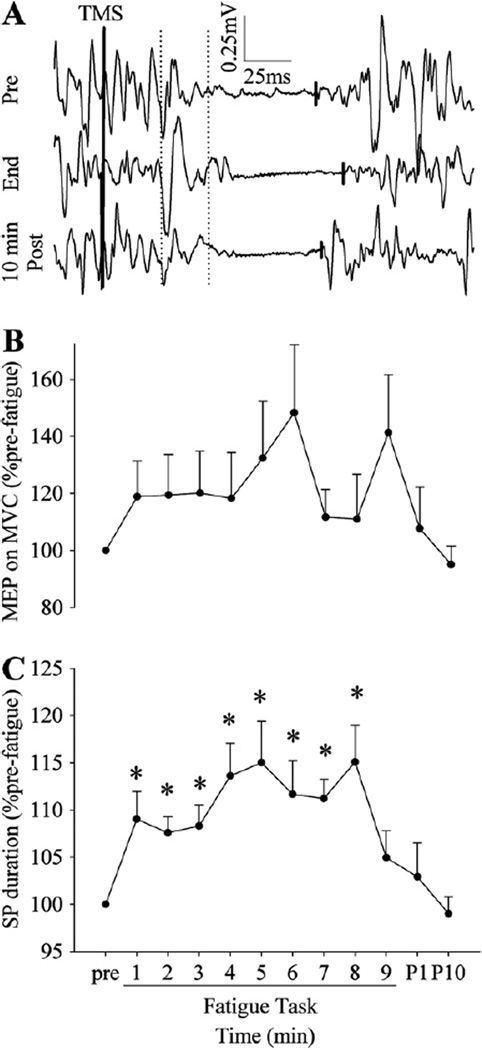
Fig. 5.
A representative example of the TMS responses recorded during MVCs (A) and changes in the MEP size (B) and SP duration (C) during and after the fatigue task. The vertical dotted lines indicate onsets and offsets of the time windows used to calculate the integrated amplitude of the MEP, and the short solid lines indicate the end of the SP. The MEP size on MVCs did not significantly change with fatigue, whereas the SP duration became longer during the 1st cycle, and then showed no change toward the end of the task. *p < 0.05 from pre-fatigue values.

