
Figure 2.
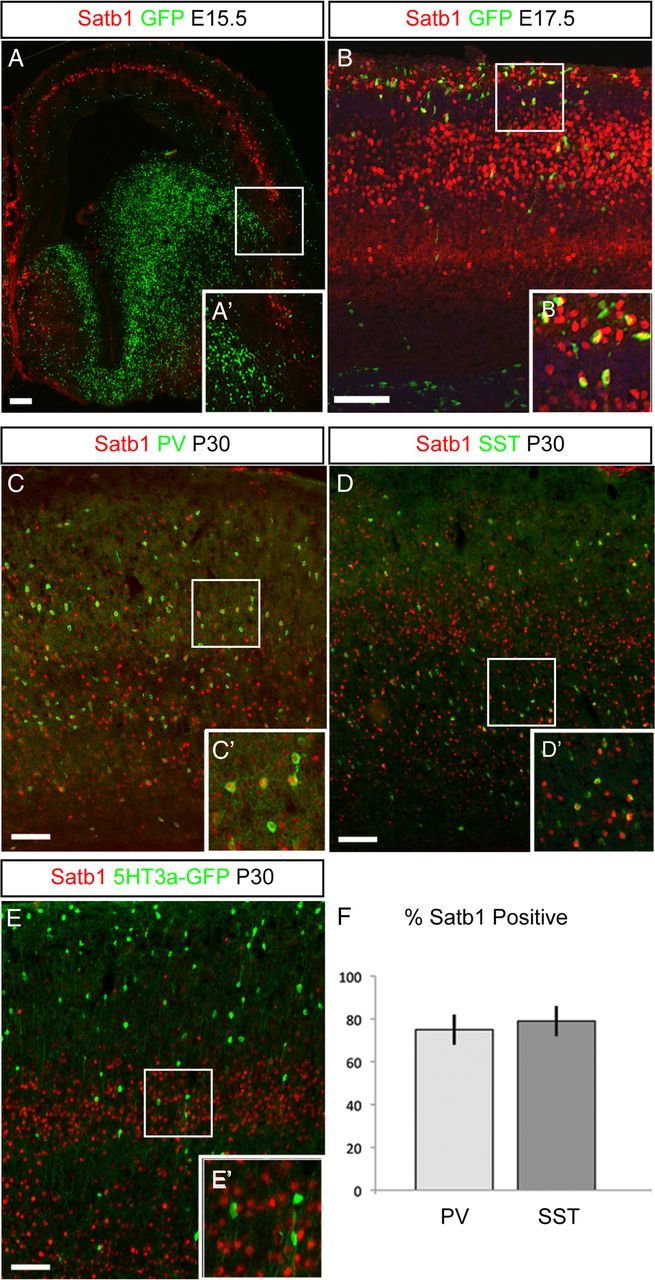
MGE-derived INs express Satb1. A, Dlx1/2CreER;RCE:LoxP pregnant females were gavaged with 4 mg of tamoxifen at E13.5. Embryonic brains were sectioned coronally at E15.5 and immunofluorescence was performed to visualize EGFP-positive IN progenitors (green) and Satb1 (red) expression. No Satb1 expression was seen in IN progenitors in the MGE or in tangentially migrating IN progenitors at this stage. A', Magnification of boxed area in A. B, Dlx1/2CreER;RCE:LoxP pregnant females were gavaged with tamoxifen at E15.5 and embryonic brains were sectioned on E17.5. In this photomicrograph, several EGFP/Satb1 double-positive IN progenitors can be visualized entering the cortical plate at this stage. B', Magnification of boxed area in B. C, Coronal section from a wild-type P30 mouse brain. Immunofluorescence for PV (green) and Satb1 (red) revealed that a majority of PV cells express Satb1 at this stage. C', Magnification of boxed area in C. D, Coronal section from a wild-type P30 mouse brain. Immunofluorescence for SST (green) and Satb1 (red) revealed a majority of SST cells express Satb1 at this stage. D', Magnification of boxed area in D. E, Coronal section from a P30 5HT3a-GFP mouse brain. Few or no CGE-derived 5HT3a-GFP-labeled cells (green) express Satb1 (red) at this stage. E', Magnification of boxed area in E. F, Quantification of PV and SST cell Satb1 expression indicated that a majority of MGE-derived cells express Satb1 at P30 (PV, 75 ± 7%; SST, 79 ± 7%; n = 5). Error bars indicate SEM. Scale bars, 50 μm.