Figure 7.
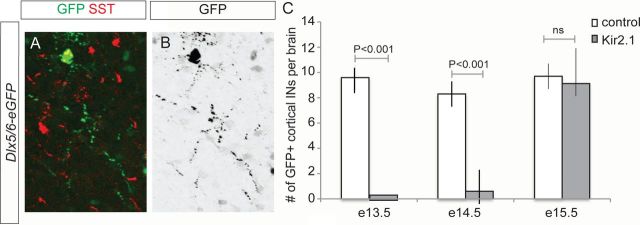
Neuronal activity blockade selectively affects the survival of MGE-derived INs. A, B, Representative example of a SST IN electroporated with a Dlx5/6-eGFP plasmid at E13.5. A, Immunohistochemistry for GFP (green) and SST (red). B, Inverted eGFP image depicting neuronal morphology. C, Quantification of the number of cortical INs at P5 after different electroporation stages. Mean values ± SD were obtained from >28 brains for each condition. p values represent the results of a paired t test.

