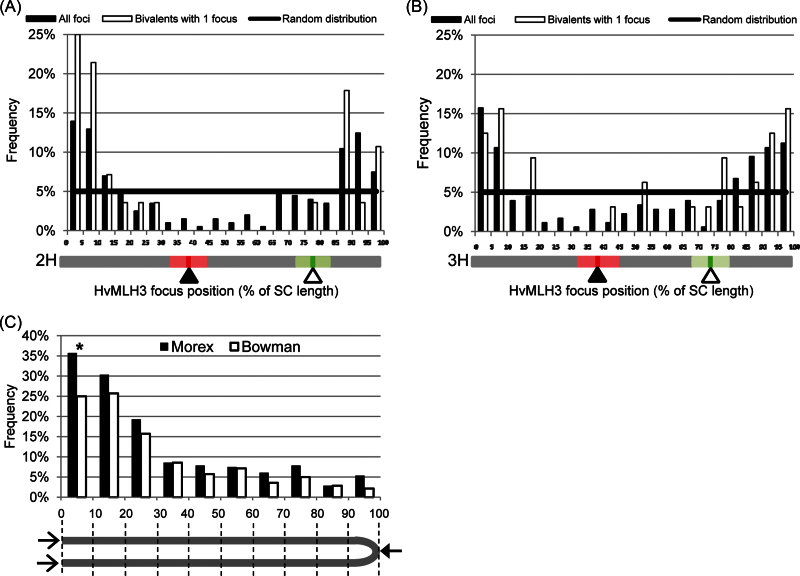
Fig. 3.
Frequencies of HvMLH3 foci along the SC. (A and B) Frequencies of all and single HvMLH3 foci along the length of the 2H (A) and 3H (B) bivalents. The diagram under each graph shows the position of the centromere (filled triangle) and 5S rDNA locus (open triangle), with standard deviations of the means indicated by the boxes. (C) Comparison of focus frequencies along all the bivalents of Morex and Bowman. Because centromeres have not been detected, the frequencies of foci have been calculated on the basis of combined 5% length intervals from both ends of the bivalent (open arrows) to the centre (filled arrow), as indicated in the diagram below the figure. Differences in HvMLH3 frequencies at each interval were tested using Fisher’s exact test (*P-value ≤0.05; **P-values ≤0.01). (This figure is available in colour at JXB online.)

