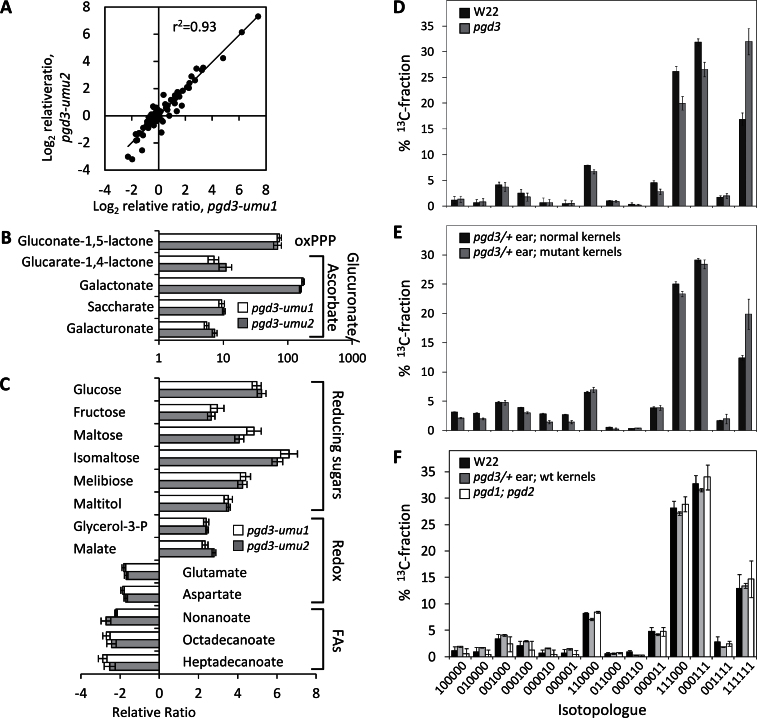
Fig. 5.
Metabolic analysis of pgd3. (A–C) Metabolite profiling in 20-DAP pgd3 endosperm. Response ratios are relative to normal sibling kernels; values close to 1 indicate no change in metabolite concentration for mutants. (A) Scatterplot of normalized relative ratios for the 74 metabolites profiled in both alleles of pgd3. (B, C) Relative ratios for selected metabolites relevant to oxPPP, glucuronic acid, ascorbic acid, redox shuttles, and fatty acids; error bars are standard errors from three biological replicates. (D–F) Altered metabolic flux into starch in pgd3-umu1. Ear block tissues were labelled with [U-13C]glucose and glucose isotopologue abundances were measured from starch by 13C-NMR spectroscopy. Relative abundance of each isotopologue from the total 13C-fractions is plotted. Each isotopologue is identified with 1 indicating 13C and 0 indicating 12C at each C position of the glucose molecule; error bars are standard deviation of three biological replicates. (D) Comparison of W22 and pgd3 homozygous ears. (E) Comparison of pgd3 mutant and normal kernels within segregating ears. (F) Comparison of W22 inbred, normal kernels within pgd3 segregating ears, and pgd1;pgd2 ears.

