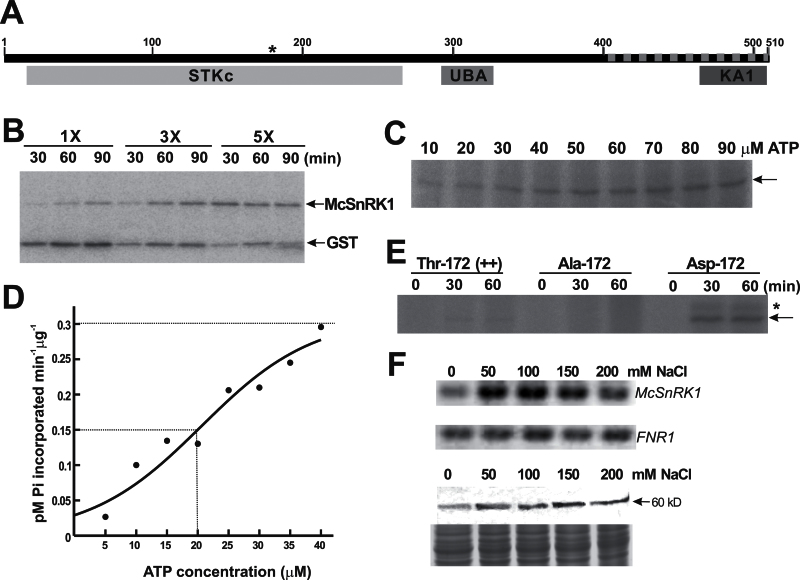
Fig. 2.
Characterization of SNF1-related protein kinase McSnRK1. (A) Predicted domain structures and conserved activation loop sequence of McSnRK1. STKc indicates the Ser/Thr protein kinase catalytic domain, UBA indicates the ubiquitin-associated domain, KA1 indicates the kinase-associated domain 1, and the dashed line indicates the sequences identified from the yeast two-hybrid screen. The position of Thr172 responsible for the catalytic activity is marked by an asterisk. (B) Analysis of autophosphorylation and substrate phosphorylation activity of McSnRK1 by in vitro kinase assay. Different amounts (1×, 0.6 μg; 3×, 1.8 μg; 5×, 3 μg) of purified GST–McSnRK1 were incubated with 10 μM ATP in the presence of [γ-32P]ATP. The reaction mixture was treated with thrombin protease before separation by SDS–PAGE. The signals were detected by autoradiography. (C) The effects of ATP on GST–McSnRK1 phosphorylation. ATP concentrations from 10 μM to 90 μM were tested. The arrow indicates the position of GST–McSnRK1 (88kDa). The autoradiogram shown is representative of three independent experiments with similar results. (D) ATP dependence of protein phosphorylation activity of McSnRK1. The ATPase activity was measured at the range of 0–40 μM ATP. The value of K 0.5 is equivalent to the ATP concentration at which V o is one-half V max (dashed lines). The experiments were repeated three times and data were calculated from one representative experiment. (E) Protein phosphorylation activities of wild-type McSnRK1 (Thr172), inactive McSnRK1 (Ala172), and constitutive active McSnRK1 (Asp172). Purified GST–McSnRK1 (Thr172), Ala172, and Asp172 were subjected to kinase assay under an excess concentration of ATP (0.1mM) for 30min and 60min. The arrow indicates the position of GST–McSnRK1, and the asterisk indicates a 100kDa phosphorylated polypeptide appearing in the Asp172 mutant of McSnRK1. (F) Gene expression and protein accumulation of McSnRK1 in cultured ice plant cells treated with different concentrations of NaCl for 1 week. Top: the expression of McSnRK1 was analysed by RT–PCR. The expression of FNR1 was used as an internal control. Bottom: the accumulation of McSnRK1 was analysed by western blotting using anti-McSnRK1 antiserum. Coomassie blue-stained total protein was used as a loading control.

