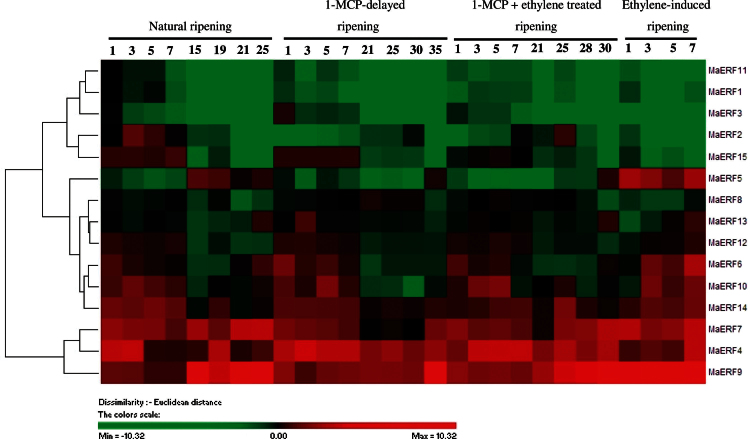
Fig. 2.
Agglomerative hierarchical cluster analysis of transcript levels from 15 MaERF genes in peel of banana fruit with four different ripening characteristics caused by natural (control), ethylene-induced, 1-MCP-delayed, and combined 1-MCP and ethylene treatments. The cluster was generated using the Pearson clustering algorithm according to gene expression profile analysis by qPCR. Data are log2-transformed (or −ΔΔCt) value of gene expression of each time point compared to day 0 of control fruit. The scale indicates log2 variations: red, increase; green, decrease. Means ± SE from three repeats are provided in Supplementary Fig. S5. The physiology data related with fruit ripening and softening, including changes in fruit firmness and ethylene production in banana fruit with these four different ripening characteristics has been described in Shan et al. (2012) (this figure is available in colour at JXB online).

