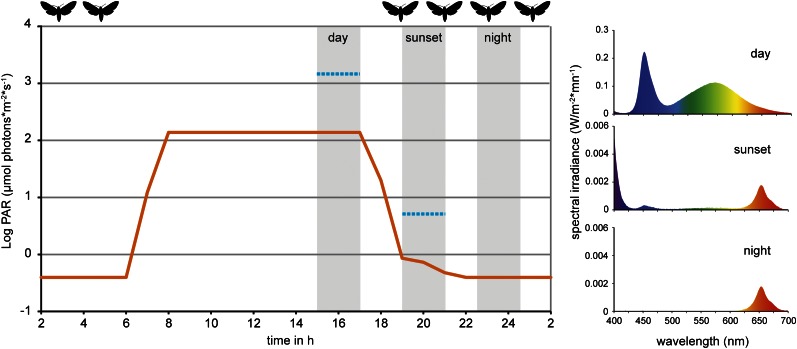
Figure 2. Light conditions during laboratory volatile collection.
Light composition and intensity changed within 24 hr to simulate day, sunset and night condition. Photosynthetically active radiation (PAR, μmol photons*m−2*s−1, orange line) was measured for every light composition and ranged from 0.39 ± 0.01 SE at night to 138.37 ± 0.09 SE at full day conditions. Blue lines denote PAR values measured in the field during the respective volatile collection event (during the night samplings, PAR was below detection limit). For the graph values were logarithmized. Grey areas denote volatile collection events; respective light spectra are shown on the right. For representational reasons time scale starts at 2 am. Flight activity, related to nectar feeding and oviposition (Madden and Chamberlin, 1945; Lingren et al., 1977), is indicated on top of the graph. For raw data, see F2_AllmannSpaethe2012_light.xlsx (Dryad: Allmann et al., 2012).

