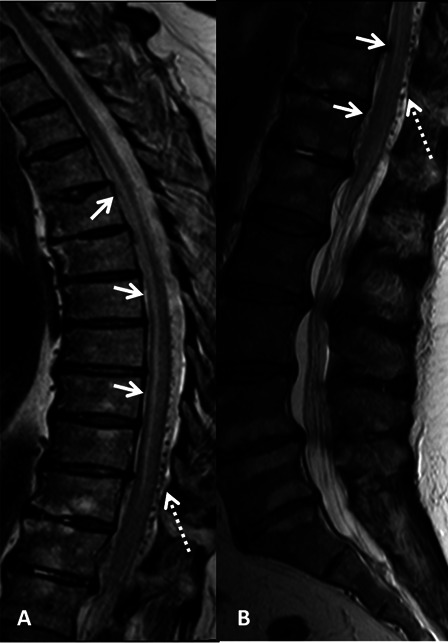
Figure 1.

T2 weighted MR image of the thoracic (A) and lumbar (B) spine of patient 2 in the sagittal plane demonstrating diffuse swelling and increased T2 signal of the cord representing cord edema (short arrows). Tortuous pathological intradural vessels are seen consistent with SDAVF (dashed arrows).
