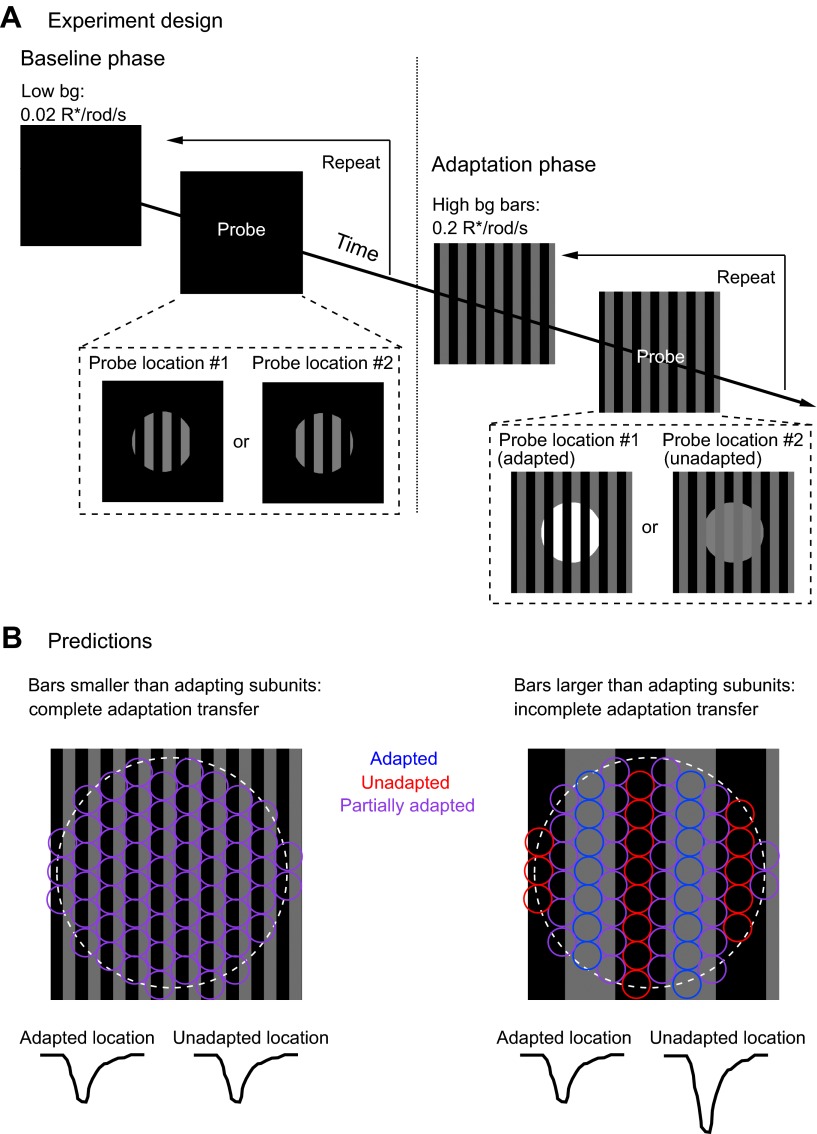
Figure 7. Measuring the spatial scale of gain control.
(A) Diagram of the experimental design. The baseline phase consisted of at least 20 trials each of two probe patterns flashed on a uniform dim background (0.02 R*/rod/s). In the adaptation phase, the same two probe patterns were presented superimposed on an adapting background of bars of higher intensity (0.2 R*/rod/s), again for at least 20 trials each. One probe location was aligned with the adapting bars (adapted location), whereas the other was out of phase (unadapted location). (B) Repeating the experiment with a variety of adapting bar sizes tests the spatial scale of adaptation. Bars up to half the diameter of the adapting subregion of the receptive field would be expected to cause a complete transfer of adaptation from the adapted to the unadapted location. Bars wider than the diameter of the adapting subregion would be expected to cause incomplete adaptation transfer.

