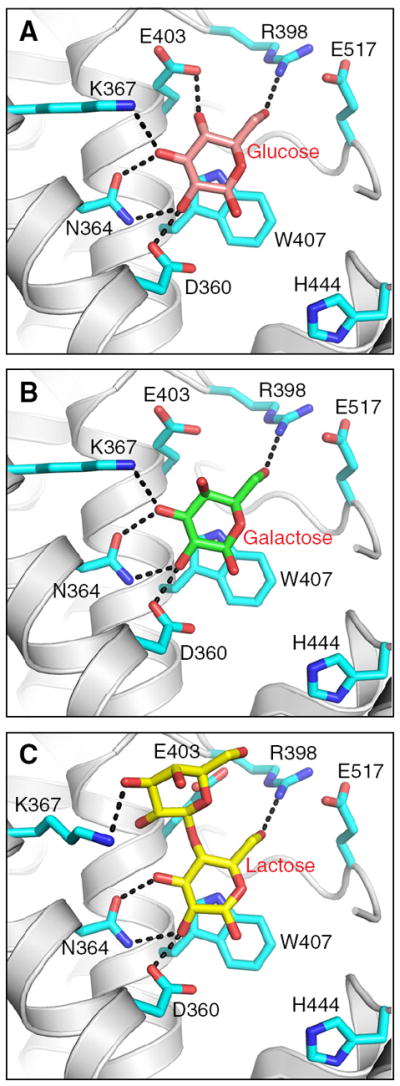
Fig. 6.

Docking of sugars into the FAPP2-C212 glycolipid headgroup surface recognition center. A) Docking of glucose. Side chains of FAPP-C212 residues involved in Glc binding are shown in cyan. The Glc sugar ring is colored cameo with red balls representing oxygen. The black dotted lines represent hydrogen bonds. B) Docking of galactose. The color scheme is the same as for A) except that the Gal sugar ring is colored green. C) Docking of lactose. The color scheme is the same as for A) except that the Lac sugar ring is colored yellow. The glucose, galactose, and lactose locations are derived from PDB IDs 3S0K, 2EVL, and 1SX6, respectively [15,16,42].
