
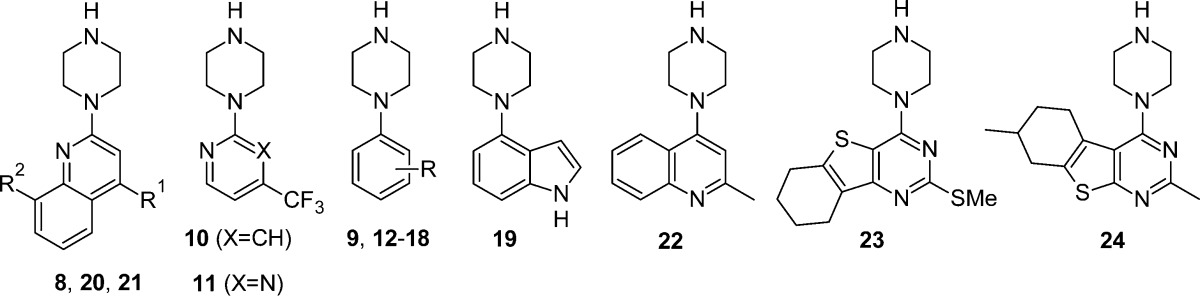
Table 1. β1AR Binding Affinities, LE, LLE, and cLogP Values of 8–24.
| compd | R, R1, R2 | β1AR pKi a | LE | cLogP b | LLE |
|---|---|---|---|---|---|
| 8 | R1, R2 = H | 5.20 | 0.44 | 1.59 | 3.61 |
| 9 | R = H | 5.87 | 0.67 | 1.11 | 4.76 |
| 10 | 5.63 | 0.48 | 1.51 | 4.12 | |
| 11 | 5.60 | 0.48 | 1.46 | 4.14 | |
| 12 | R = 3-Cl, 5-Cl | 7.07 | 0.69 | 3.03 | 4.04 |
| 13 | R = 2-Cl, 3-Cl | 6.97 | 0.68 | 2.90 | 4.07 |
| 14 | R = 3-Cl, 4-Cl | 6.67 | 0.65 | 2.67 | 4.00 |
| 15 | R = 3-Me, 4-Me | 6.13 | 0.60 | 2.03 | 4.10 |
| 16 | R = 2-Me, 3-Me | 6.27 | 0.61 | 2.03 | 4.24 |
| 17 | R = 3-CF3, 5-CF3 | 5.90 | 0.40 | 4.03 | 1.87 |
| 18 | R = 3-OMe, 5-OMe | 5.80 | 0.49 | 0.79 | 5.01 |
| 19 | 7.17 | 0.65 | 1.03 | 6.14 | |
| 20 | R1 = Me, R2 = H | 6.65 | 0.53 | 2.05 | 4.60 |
| 21 | R1 = H, R2 = 2-thienyl | 6.60 | 0.43 | 2.39 | 4.21 |
| 22 | 5.80 | 0.47 | 1.44 | 4.36 | |
| 23 | 6.70 | 0.43 | 3.69 | 3.01 | |
| 24 | 6.17 | 0.40 | 3.06 | 3.11 |
a
See Experimental Section for assay conditions; pKi = −log10 Ki.
b
Reference (56).