
Figure 2.
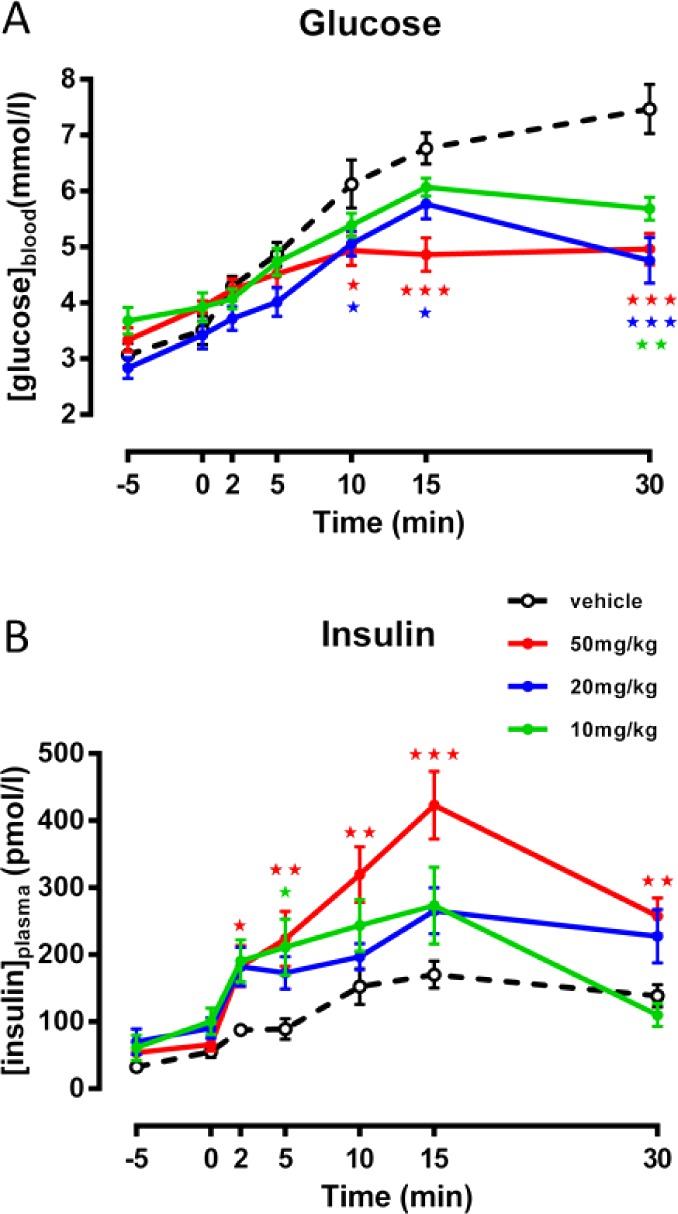
In vivo evaluation of 22 in Sprague–Dawley rats on glucose tolerance after oral dosing. (A) Effect on plasma glucose levels. (B) Effect on plasma insulin levels. Means ± standard errors (n = 6) are shown (*, p < 0.05; **, p < 0.01; ***, p < 0.001).