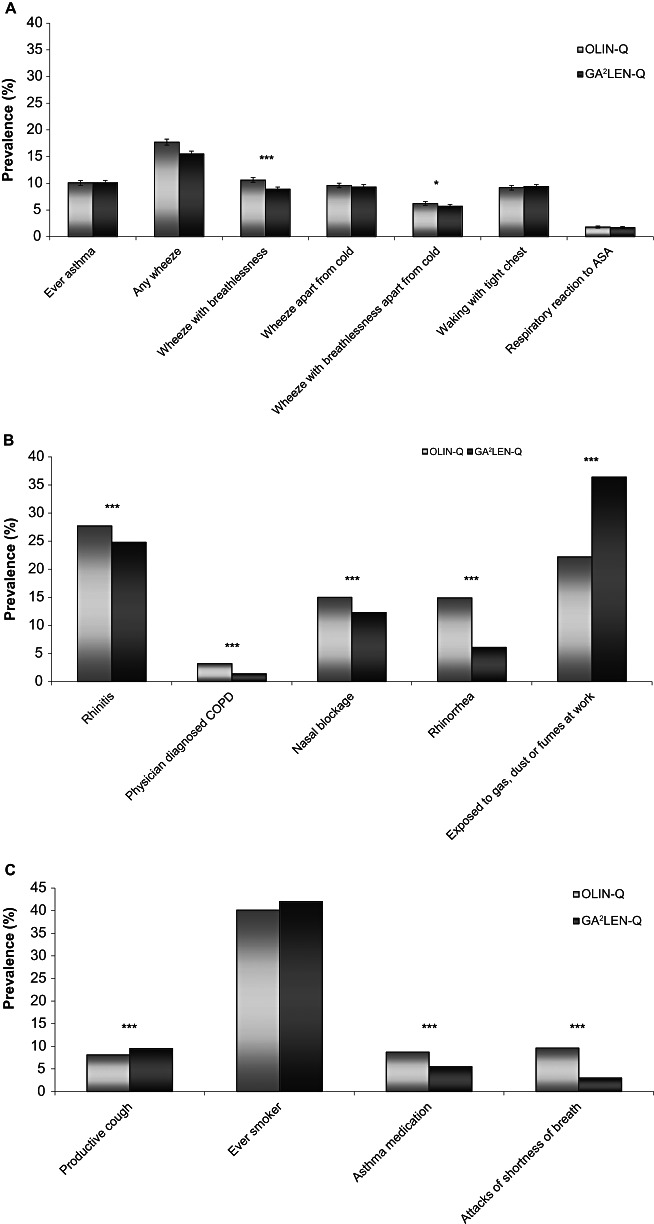
Figure 1.

Prevalence [% with 95% confidence interval (CI)] of symptoms, disease and environmental factors by questionnaire and group. (A) Group I – identical between the questionnaires, (B) Group II – same question layout but not identical symptom or condition asked for, (C) Group III – similar wording but different layout. Bars indicate 95% CIs; significant differences between the groups are indicated as follows: *P value <0.05, **P value <0.01 and ***P value <0.001. GA2LEN-Q, Global Allergy and Asthma European Network Questionnaire; OLIN-Q, Obstructive Lung Disease in Northern Sweden Questionnaire. ASA, Aspirin Sensitive Asthma.
