
Figure 5.
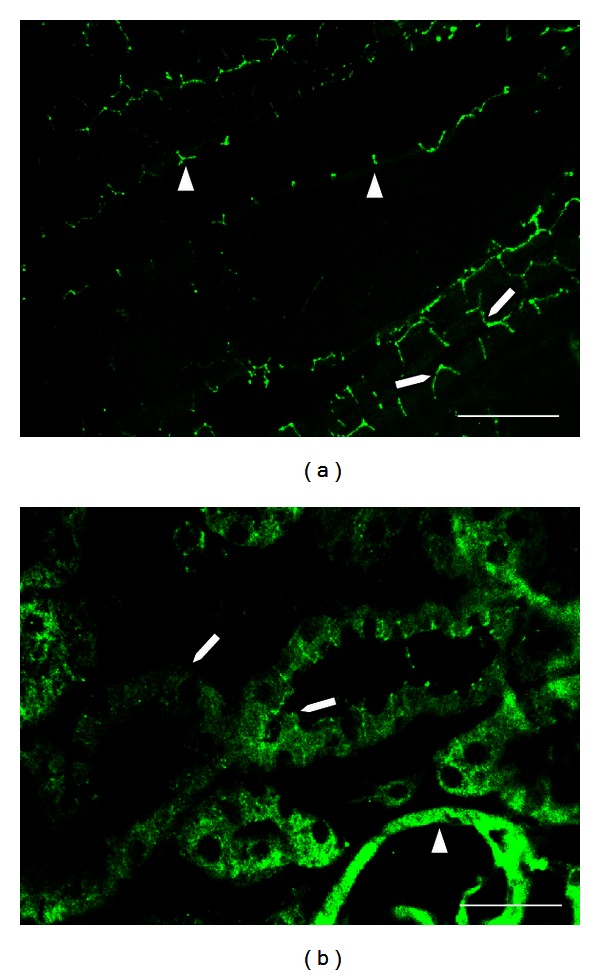
Comparative occludin distribution in tubules and vessels in kidney from a control rat and a rat treated with potassium dichromate. In control rats, occludin in vessel shows a clearly defined endothelial punctuated label (arrow heads, (a)). In tubules, label for occludin shows a typical “chicken fence” distribution (arrows, (a)). Rats treated with potassium dichromate (15 mg/kg, single dose) show severe alteration of occludin distribution in tubules (arrows, (b)), and in a vessel (arrow head, (b)). Bar = 50 μm.