
Figure 5.
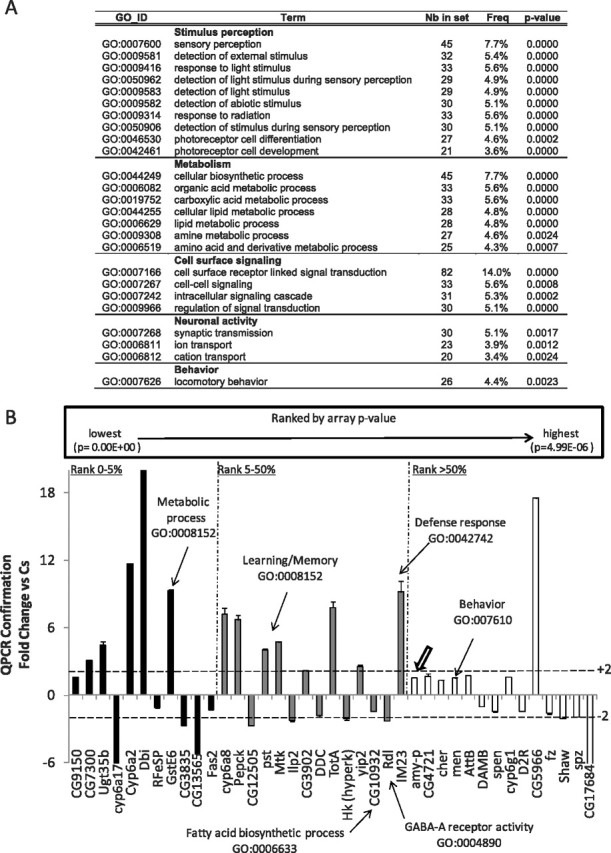
Gene expression in ins-l flies. A, GO categories identified using GOToolBox software schematic. Note the overrepresentation of genes involved in sensory perception. Nb in set, Number of genes differentially expressed for the corresponding the GO category; Freq, number of genes with the corresponding GO annotation divided by the total number of GO-annotated genes differentially expressed. B, QPCR confirmation of gene expression changes in short-sleeping ins-l flies expressed as fold change from normal-sleeping Cs controls. RNA was collected from all flies after 3 h of spontaneous waking at ZT3. Genes were rank ordered by p value, and confirmation was conducted on the top 5% (black), 5–50% (gray), and bottom 50% (white) of all genes. Thick arrow indicates confirmation of Amylase expression. Error bars represent SEM.