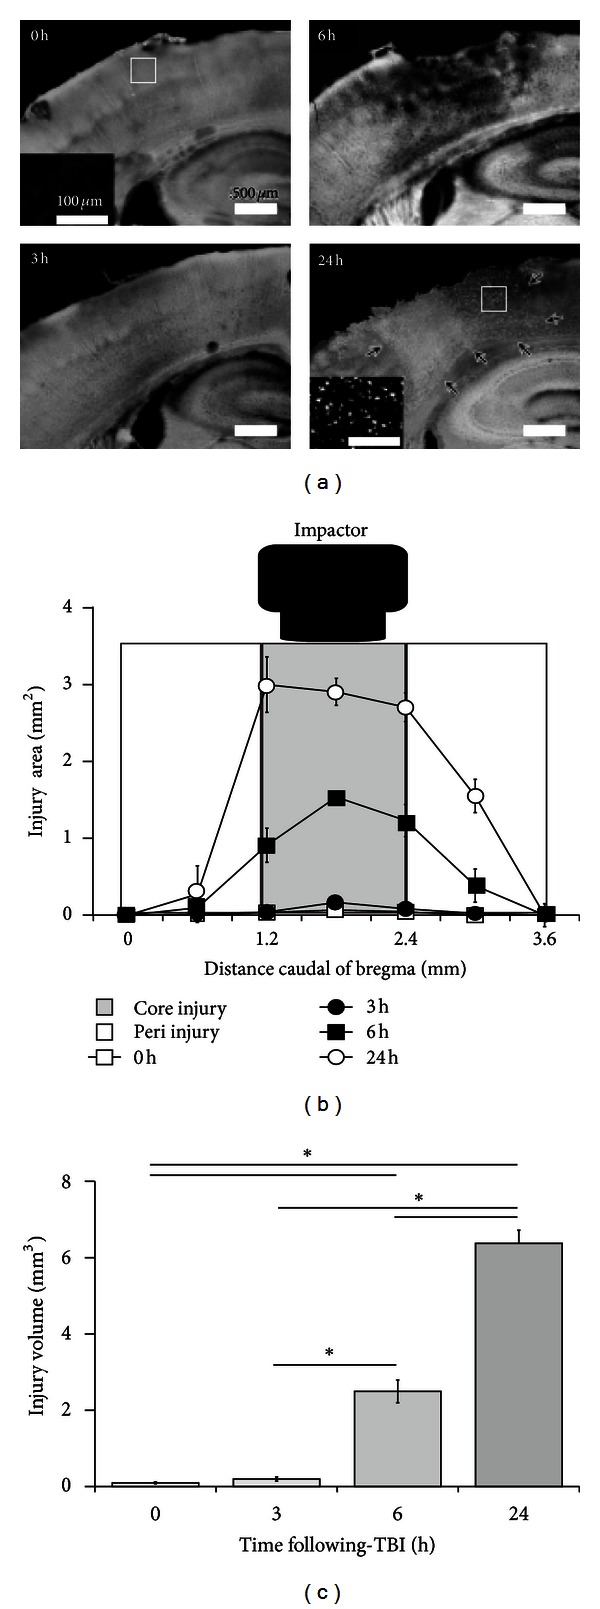
Figure 5.

Detection of neuronal cell death by FJB labeling after CCI. (a) Neuronal cell death, as indicated by FJB labeling, increases in a time-dependent manner after CCI (n = 3 at each time point). No FJB-positive cells were observed at 0 (also see inset) and 3 hours after CCI; however, by 6 and 24 hours (also see inset), FJB labeling and an increase in the area of cortical disruption produced by the contusion were observed. (b) Seven 50 μm coronal sections at 500 μm intervals were used to semiquantify the area of FJB immunoreactivity, together with the area of cortical disruption produced by the TBI. This analysis revealed a marked increase in the affected area at 6 and 24 hours. Data are expressed as mean ± SEM (n = 3). (c) A significant increase in the TBI volume was observed 6 and 24 hours following CCI. Data are expressed as mean ± SEM (n = 3). Asterisk (∗) indicates a significant difference between groups based on Tukey-Kramer tests (P values are described in the text).
