
Figure 9.
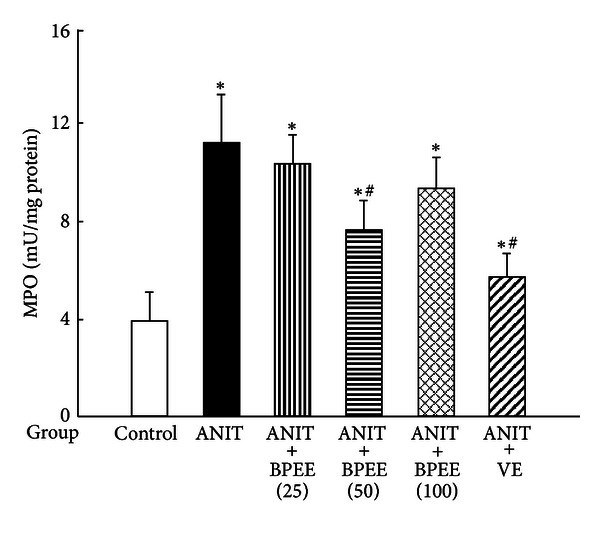
Effects of administered BPEE and VE on hepatic MPO activity in ANIT-treated rats. Experimental condition and explanation are the same as described in the legend of Figure 1 except that MPO in liver tissues was assayed at 24 h after ANIT treatment as described in Section 2. Each value is a mean ± S.D. (n = 5 for Control group; n = 7 for each group with ANIT treatment). *P < 0.05 (versus Control group); # P < 0.05 (versus ANIT group).