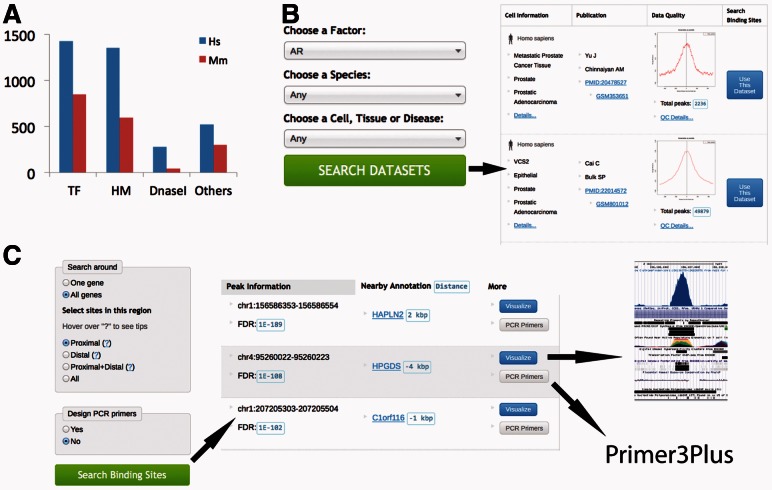
Fig. 1.
(A) Statistics of datasets in CistromeFinder, the height of bar represents the number of datasets under each category: transcription factor (TF), histone modification (HM), DNaseI and others (such as chromatin regulators), of Homo sapiens (Hs) and Mus musculus (Mm). (B) Screenshot of dataset pages. (C) Screenshot for binding sites pages

