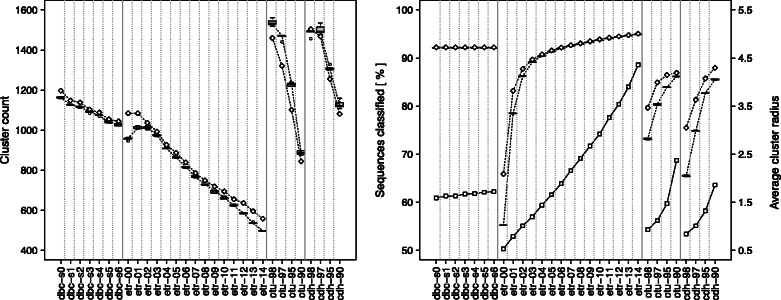
Fig. 4.

Number of clusters, percentage of sequences classified and average cluster radius for the various algorithms/parameters tested. Left: number of clusters containing at least 100 sequences. Right: percentage of the 1 152 122 input sequences classified in clusters containing at least 100 sequences. The value for the original ITS1 dataset is shown with a white diamond; boxplots show the values obtained for the five mutated datasets. The average cluster radius for the original ITS1 dataset is shown with white squares on the right plot
