
Fig. 5.
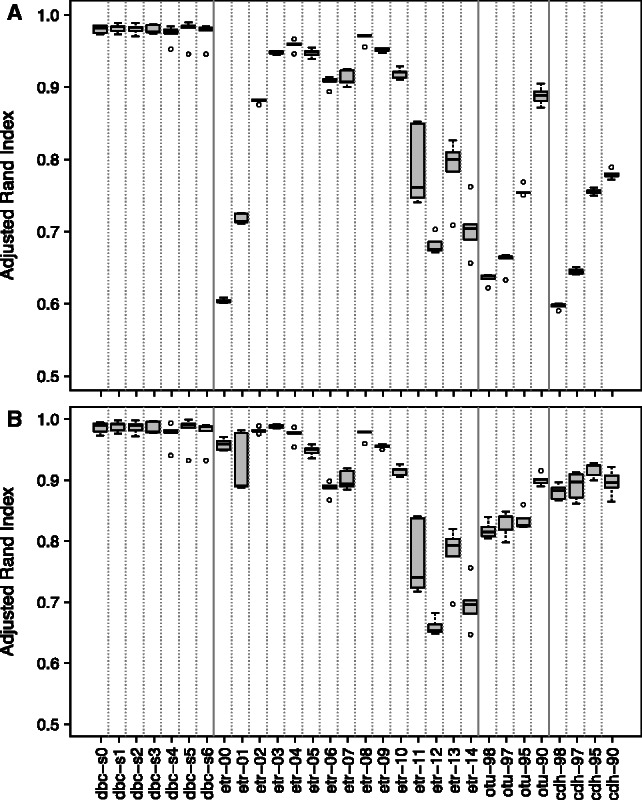
Robustness analysis. Each box represents the ARIs of five comparisons of the original partition with the partitions obtained with the five artificially mutated datasets, for the various algorithms/parameters, as given in Section 2. Above: all clusters with less than 100 members were attributed to noise, and this was treated as a single additional cluster. Below: sequences appearing in the noise either in the original dataset or in the mutated dataset were not taken into account