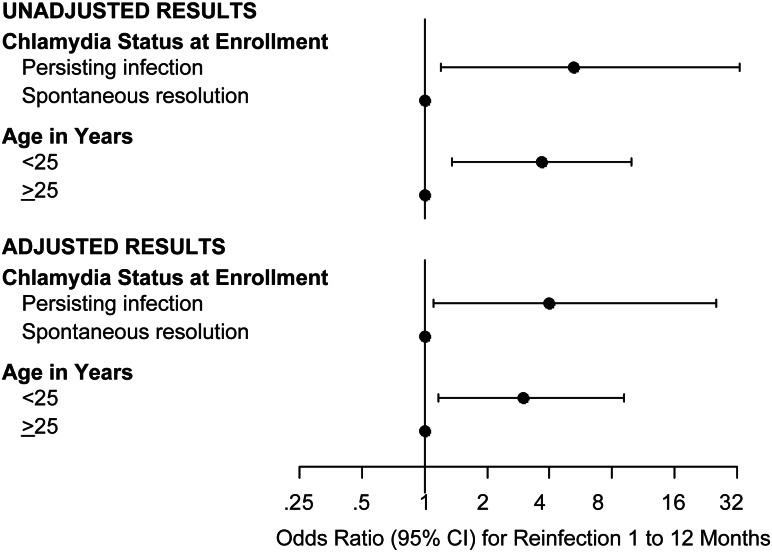
Figure 1.
Forest plot of odds ratios and 95% CI for chlamydia reinfection at follow-up based on chlamydia resolution status at enrollment (time of treatment) and age. Estimates to the right of the vertical line indicate reinfection is more likely, and those to the left indicate reinfection is less likely. When the 95% confidence interval does not cross the vertical line, then the odds ratio is significantly different from 1. Unadjusted results are from separate univariate analyses for chlamydia resolution status at enrollment (the time of treatment) and age. Adjusted results are estimates from a multivariable model, including chlamydia resolution status at enrollment and age as independent variables. Abbreviation: CI, confidence interval.

