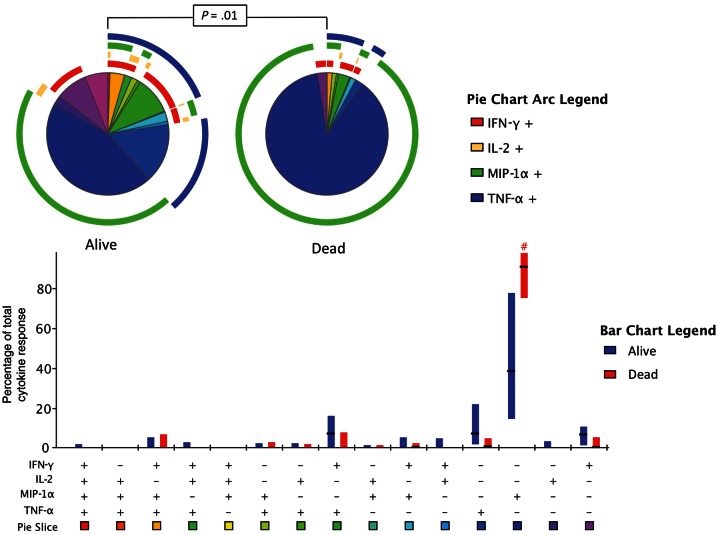
Figure 4.
Differences in functional phenotype of the cryptococcal antigen (CRAG)–specific responses at baseline between subjects who survived and subjects who died. Results of flow cytometry of interferon γ (IFN-γ), interleukin 2 (IL-2), macrophage inflammatory protein 1α (MIP-1α), and tumor necrosis factor α (TNF-α) production within CRAG-specific CD4+ memory T cells at baseline for patients who survived to 2 weeks and those who died are shown. The bar chart shows each of the 15 possible response profiles on the x-axis. The percentage of the total cytokine response is shown on the y-axis, with the filled bar representing the interquartile range and a line at the median. CRAG-specific responses in survivors are shown in blue, and response for those who died are in red. Statistically significant differences (P < .05) on rank-sum testing are indicated by the pound sign. The pie charts show the fractions according to the pie-slice colors shown at the bottom of the bar chart, with color-coded circles indicating the contributions of IFN-γ (red), IL-2 (yellow), MIP-1α (green), and TNF-α (blue) to the 4-, 3-, 2-, and 1-function responses. Statistical comparisons of the overall responses in those who survived versus those who died by permutation testing are shown in the pie category test result chart.

