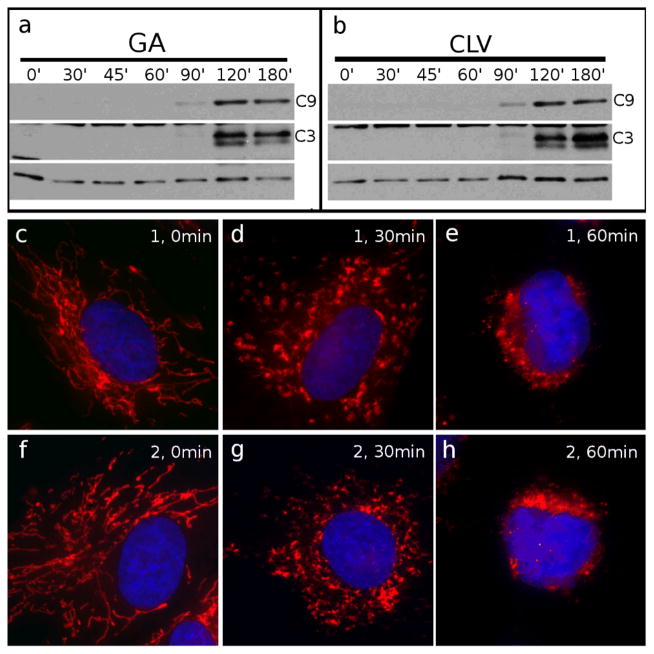
Figure 3.
Comparison between GA and CLV with respect to mitochondrial fragmentation and induction of apoptosis. Cells treated with GA (a) or CLV (b) for the indicated amounts of time (from 0 min to 180 min) were processed for WB analysis to show activation of the mitochondria-dependent apoptosis pathway, represented by caspase-9 (C9) and by the downstream executioner caspase-3 (C3). Cells treated with GA for 0 min (c), 30 min (d) and 60 min (e) or with CLV for 0 min (f), 30 min (g) and 60 min (h) were analyzed by IF to reveal the status of the mitochondria. Mitochondria are in red, nuclei are in blue. Tubulin (bottom line) was used as loading control.

