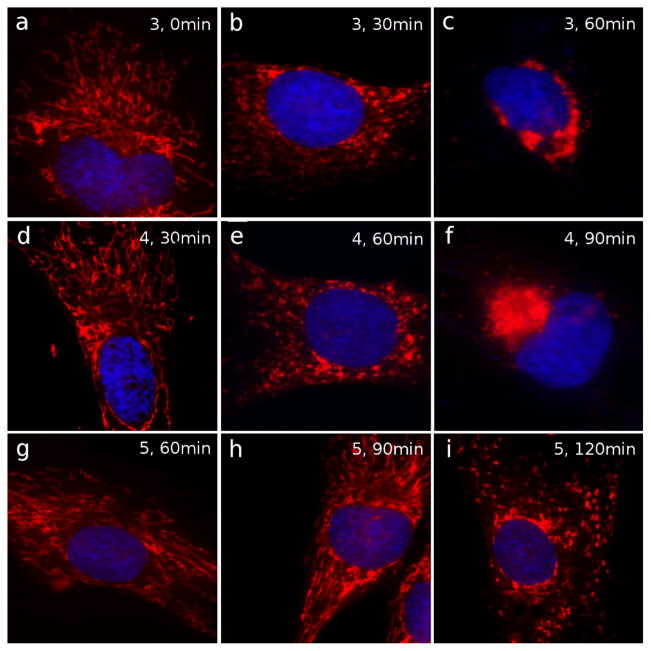
Figure 5.
Effect of 3, 4 and 5 on mitochondria. Cells treated with compounds 3, 4 and 5 were imaged to visualize mitochondrial structure by IF. DMSO-treated control cells are in (a). Top panel: treatment with 3 for 30 min (b) and 60 min (c). Middle panel: treatment with 4 for 30 min (d), 60 min (e) and 90 min (f). Bottom panel: treatment with 5 for 60 min (g), 90 min (h), 120 min (i). Mitochondria are shown in red; nuclei are in blue. Intact mitochondria are shown in a, d, g and h. Initial level of fragmentation is observed in b, e, and i. More extensive fragmentation is observed in c and f.

