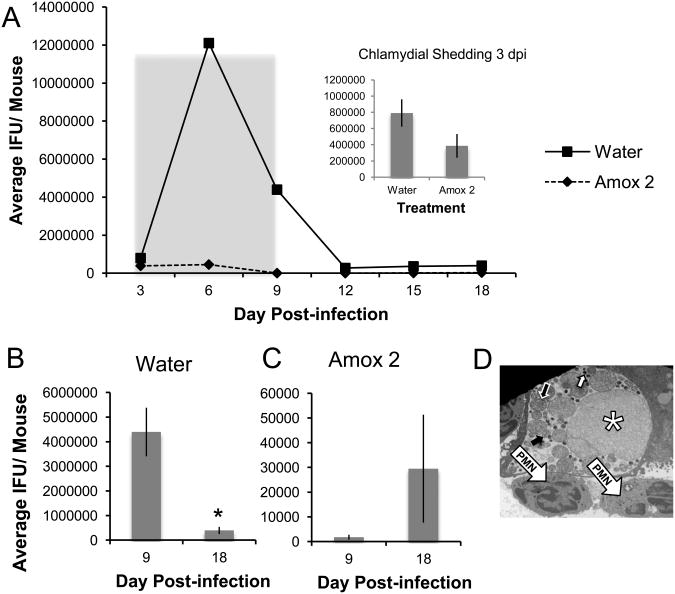
Figure 5.
Secondary shedding and ABs are also observed in C. muridarum-infected mice when amox treatment is initiated earlier during infection. Mice were infected with 106 IFU C. muridarum and amox treated from day 3 to day 9 pi. Vaginal swabs were collected every third day and titered to determine total infectious EBs shed. The shedding profile over the course of the entire experiment is shown in panel A. The panel A inset as well as panels B and C are comparisons of shedding at day 3 (immediately before the first treatment), day 9 (the last day of treatment) and day 18 (9 days after treatment termination) for water- (panel B) and 2mg/kb amox-gavaged (panel C) C. muridarum-infected animals. Triplicate inclusion counts were averaged and used to calculate inclusion forming units (IFU)/mL. The average of 10 mice ± SEM from one of two independent experiments is shown. Groups significantly different from diluent-exposed, infected control mice are indicated by asterisks (*) in panels B and C, P ≤ 0.05 was considered significant. Panel D shows a representative TEM photomicrograph of genital tract tissue isolated from a 2mg/kg treated, C. muridarum-infected mouse at 5 dpi (2 days after treatment initiation). Transmission electron micrographs are shown at 7000× magnification; scale bars measure 2 um. RBs are indicated by white-outlined black arrows, EBs by black-outlined white arrows, IBs by solid black arrows, and ABs by asterisks. White arrow indicates PMN.

