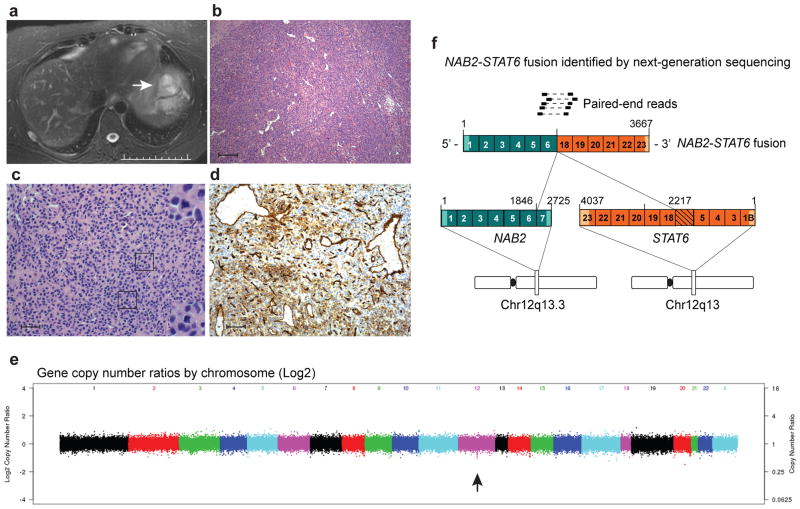
Figure 1.
Integrative sequencing and mutational analysis of patient MO_1005 (SFT index case). (a) CT image of the biopsied liver metastasis (arrow). Arrow indicates metastasis that was biopsied. Scale bar equals 10 cm. (b) Hematoxylin and eosin staining of index case. Scale bar, 200 μm. (c) Hematoxylin and eosin staining of index case. Scale bar, 100 μm. Please note, b and c differ only in magnification. (d) Immunoreactivity for CD34. Scale bar, 100 μm. Images in a–d were all produced from a liver biopsy sample from the index case. (e) Gene copy number landscape of the index case as assessed by whole-exome sequencing of the tumor to germline sequence. The arrow indicates copy loss at the STAT6 locus. (f) Schematic of the NAB2-STAT6 gene fusion detected in the index case by paired-end transcriptome sequencing. The hashed region indicates exons not shown.

