Figure 3.
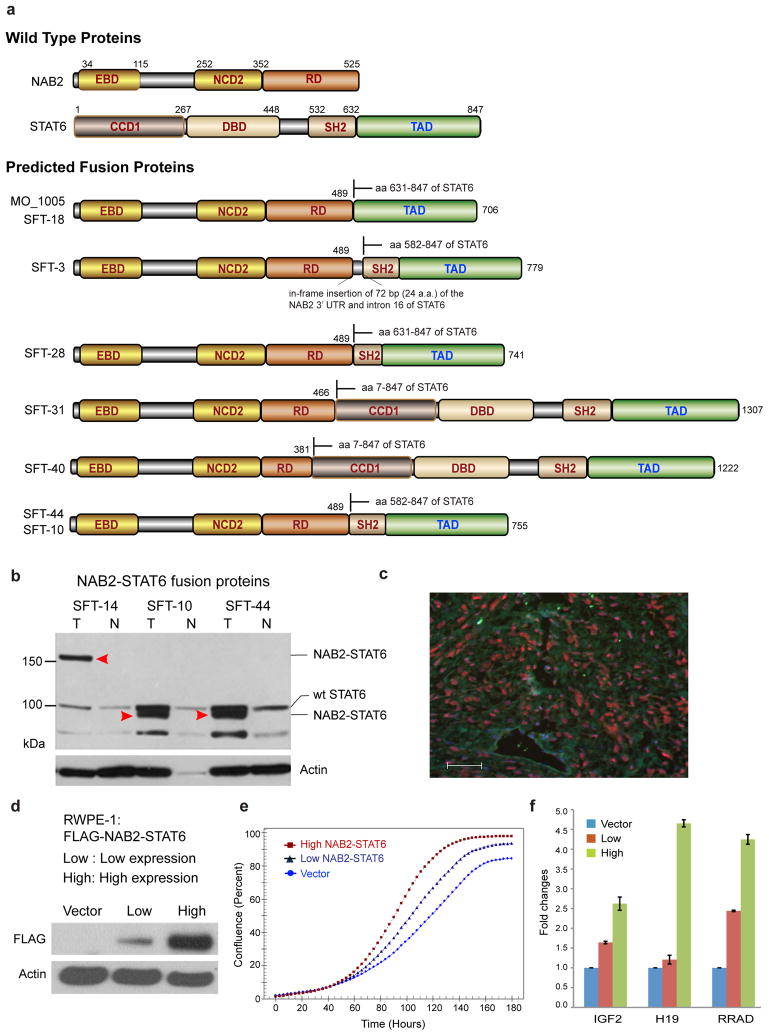
Characterization and functional analysis of the NAB2-STAT6 fusion protein. (a) Schematics of the predicted NAB2-STAT6 fusion protein products identified in this study. EBD, EGR1-binding domain; NCD2, NAB2 conserved domain; RD, transcriptional repressor domain; SH2, Src homology 2; CCD1, coiled-coil domain 1; DBD, DNA-binding domain; TAD, transcriptional activator domain. (b) Immunoblot analysis of three SFT tumors (T) and matched normal tissue (N) employing an antibody against a C-terminal epitope of STAT6, which is found in all the NAB2-STAT6 fusions thus far identified. SFT-14 tumor expresses the larger 150-kDa NAB2-STAT6 fusion protein. SFT-10 and SFT-44 tumors both express the smaller, more common 90-kDa NAB2-STAT6 fusion. MW, molecular weight; WT, wild type. Arrowheads indicate NAB2-STAT6 fusion proteins. (c) Immunofluorescence using the antibody in b, suggesting nuclear localization (red) of the NAB2-STAT6 protein in a representative SFT case. Scale bar, 50 μm. (d–f) Stable RWPE-1 cell line pools expressing low and high levels of Flag-tagged NAB2-STAT6 (MO_1005 fusion structure) were generated. (d) Immunoblot analysis with an antibody to Flag. (e) Cell proliferation assays carried out with live-cell imaging. Data are shown as cell confluence versus time at 3-h intervals. Each data point is the mean of quadruplicate measurements. (f) qRT-PCR for EGR1 target genes IGF2, H19 and RRAD. Results were normalized to GAPDH levels. Means of triplicates with the s.d. are shown.

