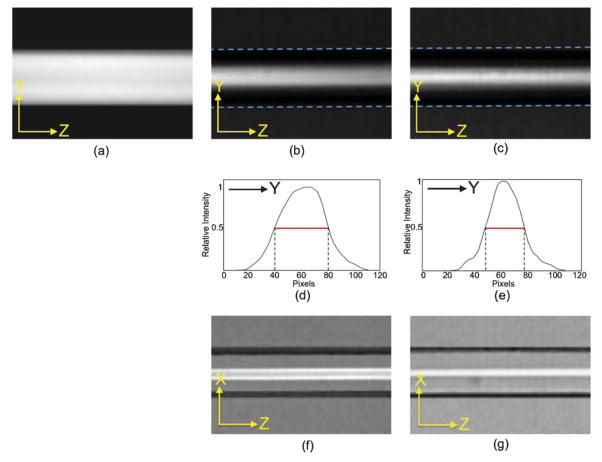
Fig. 6.
Micrographs of fluorescent intensity distributions. Side view to illustrate y-confinement for (a) 2D-design, (b) 3D-design at 1 : 10 sample/sheath flow ratio, and (c) 3D-deisgn at 1 : 40 sample/sheath flow ratio. (d), (e): Intensity profile for micrographs (b) and (c). Top view to illustrate x-confinement for (f) 3D-deisgn at 1 : 10 sample/sheath flow ratio and (g) 3D-deisgn at 1 : 40 sample/sheath flow ratio.

