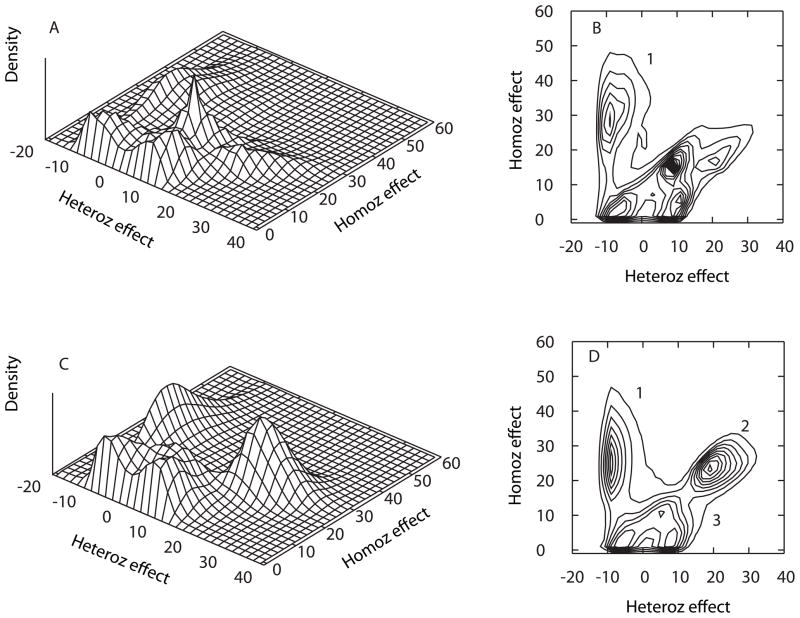
Figure 1.
Posterior distribution of QTL model genotype effects in the absence (A, B) and presence (C, D) of APOE as a covariate. Panels A and C depict 3-dimensional histograms of the posterior density of parameter estimates for the heterozygous vs. homozygous effects (see text in Methods). Panels B and D depict contour plots of the same information.

