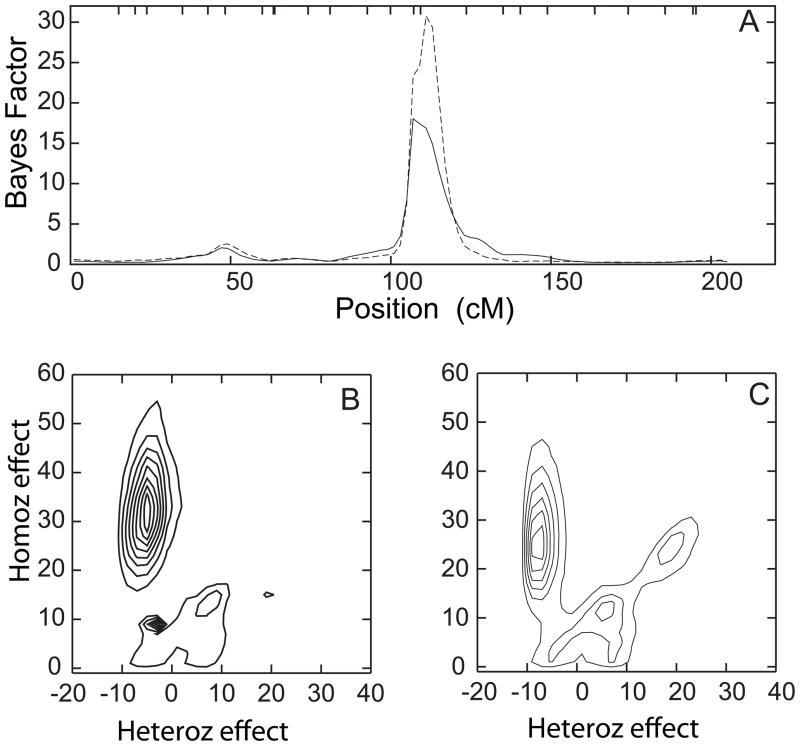
Figure 3.
Detailed depiction of results for QTL models that have location parameter values anywhere on chromosome 6, based on a long MCMC run. Parameters are as described in Figure 1. Linkage analysis results (panel A) with (solid line) and without (dashed line) adjusting for APOE as a covariate, and contour plots of posterior distribution of QTL model parameter densities from the same analysis runs with (Panel B) and without (Panel C) adjustment for APOE as a covariate. The majority of QTL models with parameter values for QTL location on chromosome 6 fall near the region with the strongest evidence for linkage, and thus describe the QTL models with strongest support in this region.

