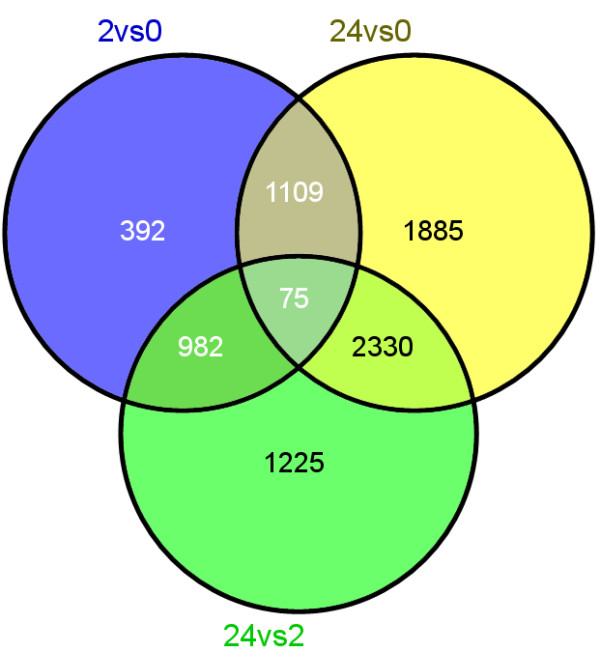
Figure 3.

Differences between each pair of samples. Overlap examinations were performed basing on the resulting gene lists of three comparisons by VENNY [58]. Overlap among three groups, 2 h vs 0 h (blue), 24 h vs 0 h (yellow) and 24 h vs 2 h (green), were showed here.
