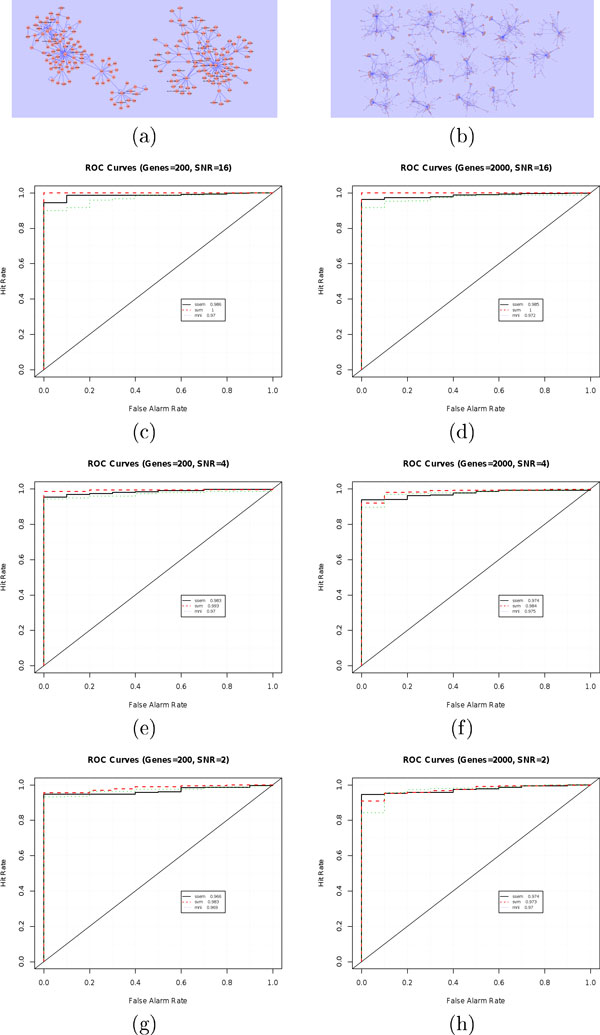
Figure 1.
Sensitivity and specificity for simulated datasets. Figures c, e and g show the ROC curve for the 200 genes network (a) for respectively 16, 4 and 2 SNR. Figures d, f and h show the ROC curve for the 2000 genes network (b) for respectively 16, 4 and 2 SNR. The ROC lines are respectively continuous, dashed and dotted for SSEM, SVM and MNI.

