Figure 1.

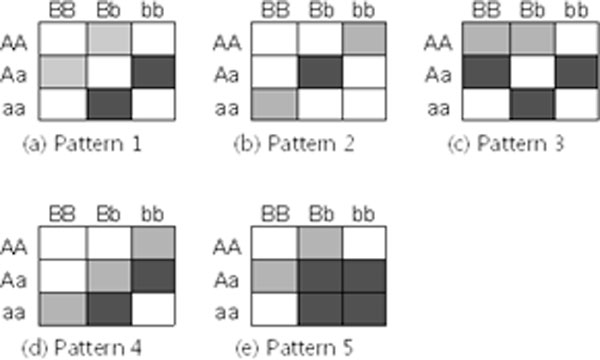
Simulated patterns of 2-way interactions. White, light grey and dark grey colors indicate respectively three classes (e.g., normal, low risk, high risk) of an ordinary trait.

Simulated patterns of 2-way interactions. White, light grey and dark grey colors indicate respectively three classes (e.g., normal, low risk, high risk) of an ordinary trait.