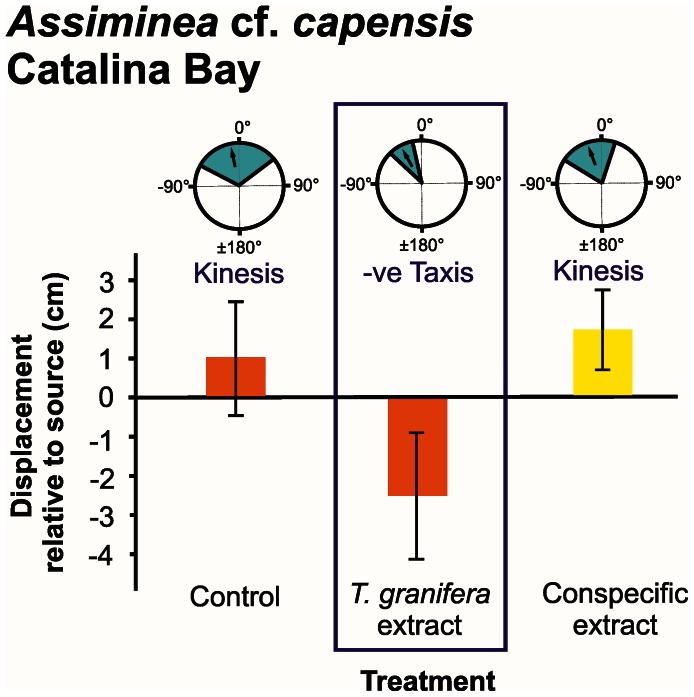
Figure 2. Assiminea cf. capensis orientation and movement responses to different chemical cue treatments at Catalina Bay.
Three types of data are presented: (1) Mean turning angles distribution in response to chemical cue treatments (pie graphics). Arrows represent the overall mean for the treatment and shaded slices represent 95% CIs. Type of motion, i.e. taxis or kinesis, is indicated; (2) Mean displacement (± s.d.) of individuals relative to the source of chemical cue (bar graphics); (3) Average number of steps taken by individuals during the experiment (colour legend: yellow = 3 to 5 steps, orange = 6 to 9 steps, red = 10 to 13 steps). Treatments where a negative (−ve) taxis response occurred are demarcated. Individuals were tracked over a period of three minutes.

