Figure 1.

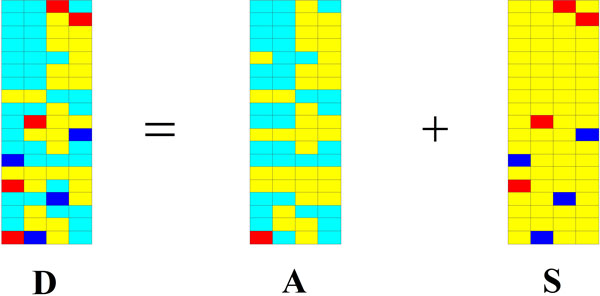
The RPCA model of microarray data. The white and yellow blocks denote zero and near-zero in this figure. Red and blue blocks denote the perturbation signals.

The RPCA model of microarray data. The white and yellow blocks denote zero and near-zero in this figure. Red and blue blocks denote the perturbation signals.