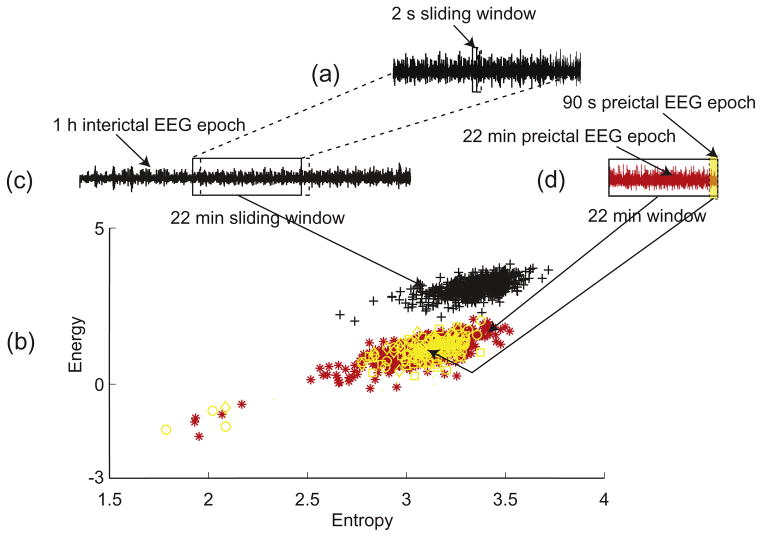
Fig. 2.
Illustration of the energy and entropy space and processing of the EEG epochs using a sliding 2 s window. (a) A 2 s window moves over the 22 min window. A point (represented by a symbol) in the energy and entropy space represented in (b) is calculated in a 2 s window. (b) Energy and entropy profile of the 22 min interictal epoch (black symbols), the 22 min preictal epoch (red symbols) and three 90 s immediate preictal epochs (yellow symbols). (c) A 22 min window moves over a 1 h interictal epoch from one channel. (d) 90 s immediate preictal epoch (yellow shaded area) and 22 min preictal epoch (red signal).

