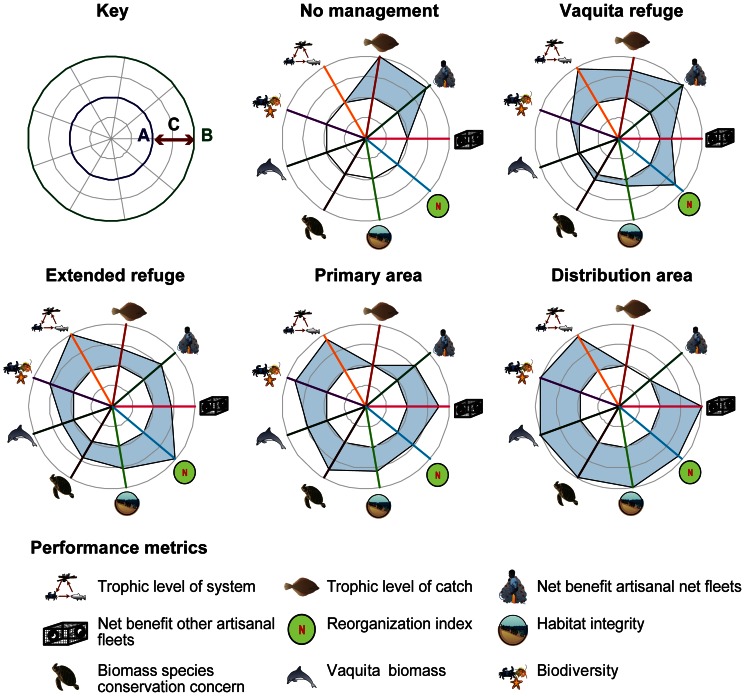
Figure 6. Performance of selected metrics across management scenarios.
Since the metrics are not directly comparable (in absolute or relative change), we have scaled the performance metrics between the worst result observed (A/blue circle) and the best result observed (B/green circle); the range in between (C) shows the scope of possible outcomes. Symbols courtesy of IAN/UMCES Symbol and Image Libraries.

