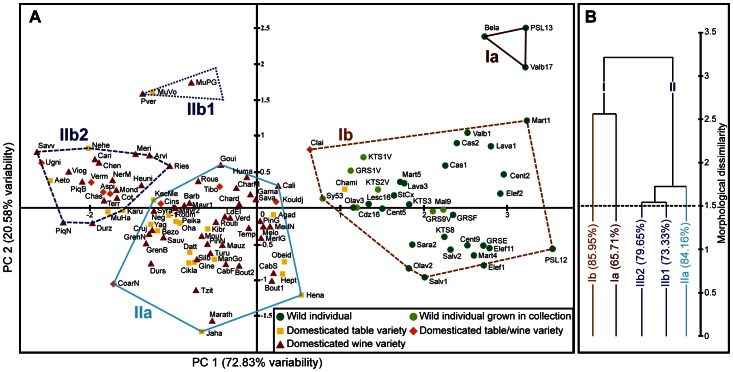
Figure 3. Principal Component Analysis of modern cultivars and wild individuals and subsequent Cluster Analysis (UPGMA) based on centroid coordinates on PC1 and 2.
A, PCA biplot of axes 1 and 2 (93.41% variability). For more clarity only the centroid of each group is represented. B, UPGMA dendrogram representing sub-groups identified at an arbitrary Euclidian distance of 1.5 (dotted line) with indication of the discriminant rate (%) calculated by LDA. For composition of sub-groups see A.

